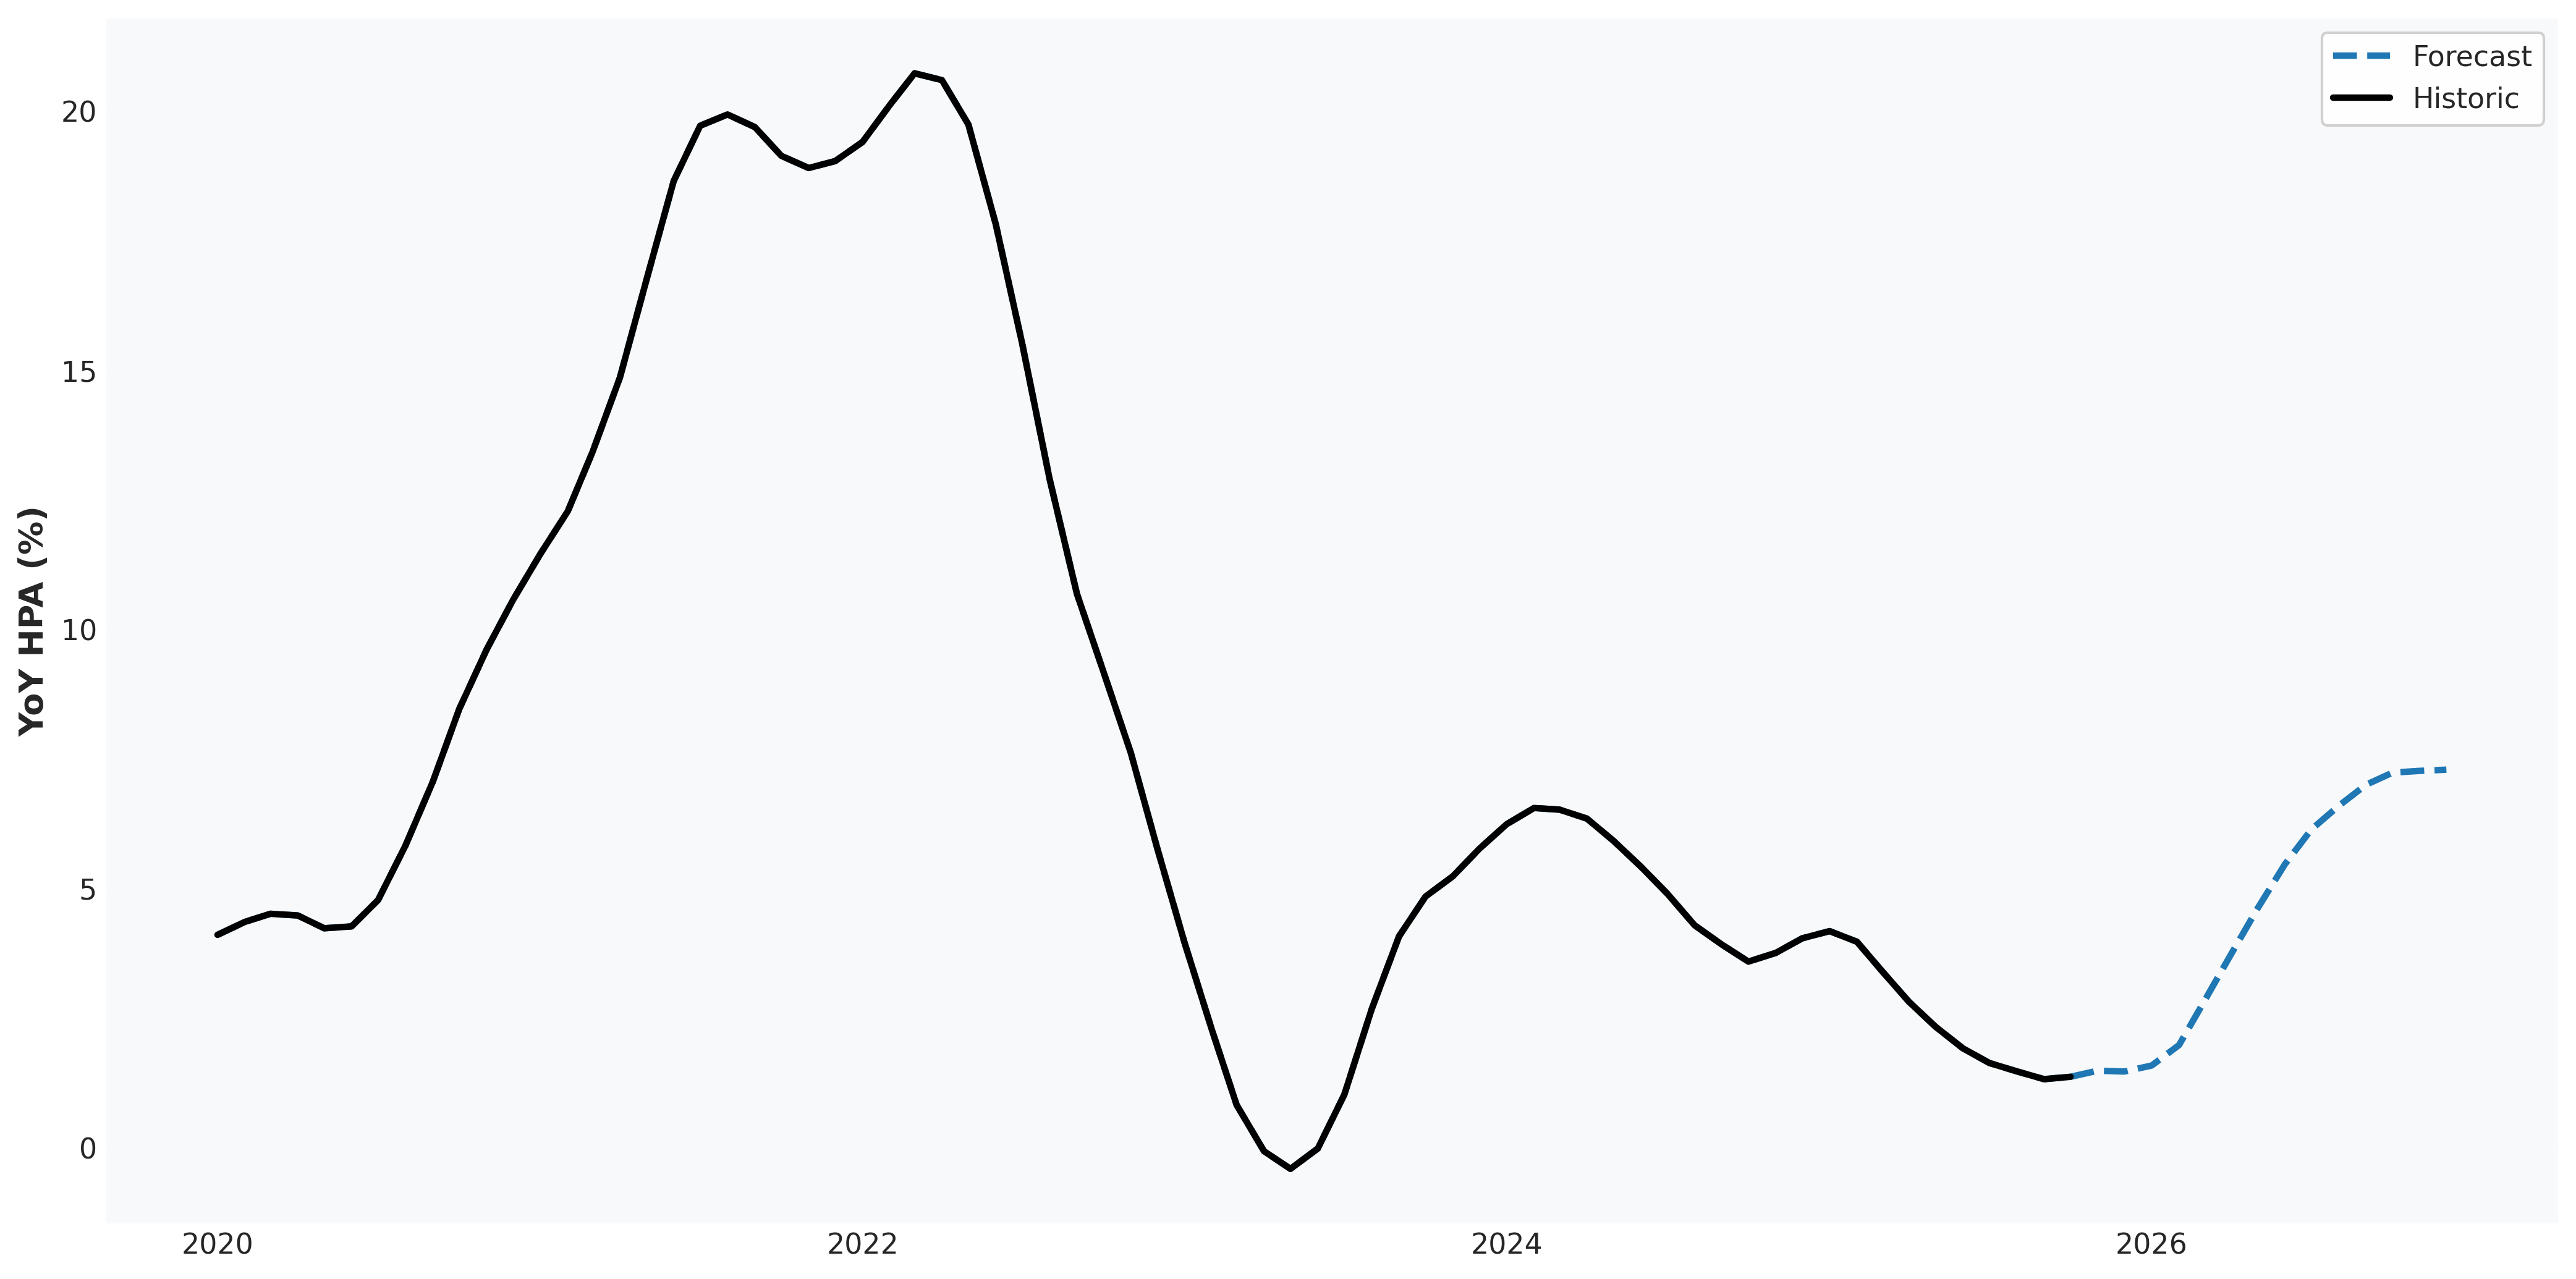
Home appreciation has slowed through most of 2024 & 2025 due to elevated mortgage rates, causing a drop in housing sales and thus also an accumulation in inventory. However, the recent ~60bp mortgage rate decrease since June has elevated total sales 5.3%, driving appreciation back positive as the October Case-Shiller HPA has come in at 0.4% MoM (4.5% SAAR), 1.4% YoY.
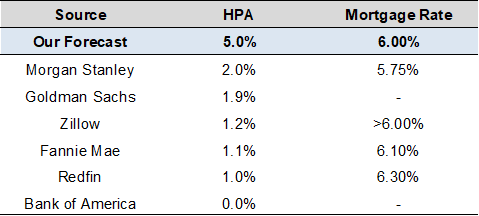
In 2026, housing supply and demand dynamics in a flat rate environment support a ~5% YoY HPA prediction, which is meaningfully higher than the institutional research consensus of 0-2%. The analysis below justifies this difference in expectation and also proposes a framework for projecting HPA with mortgage rate scenarios in standard economic regimes.
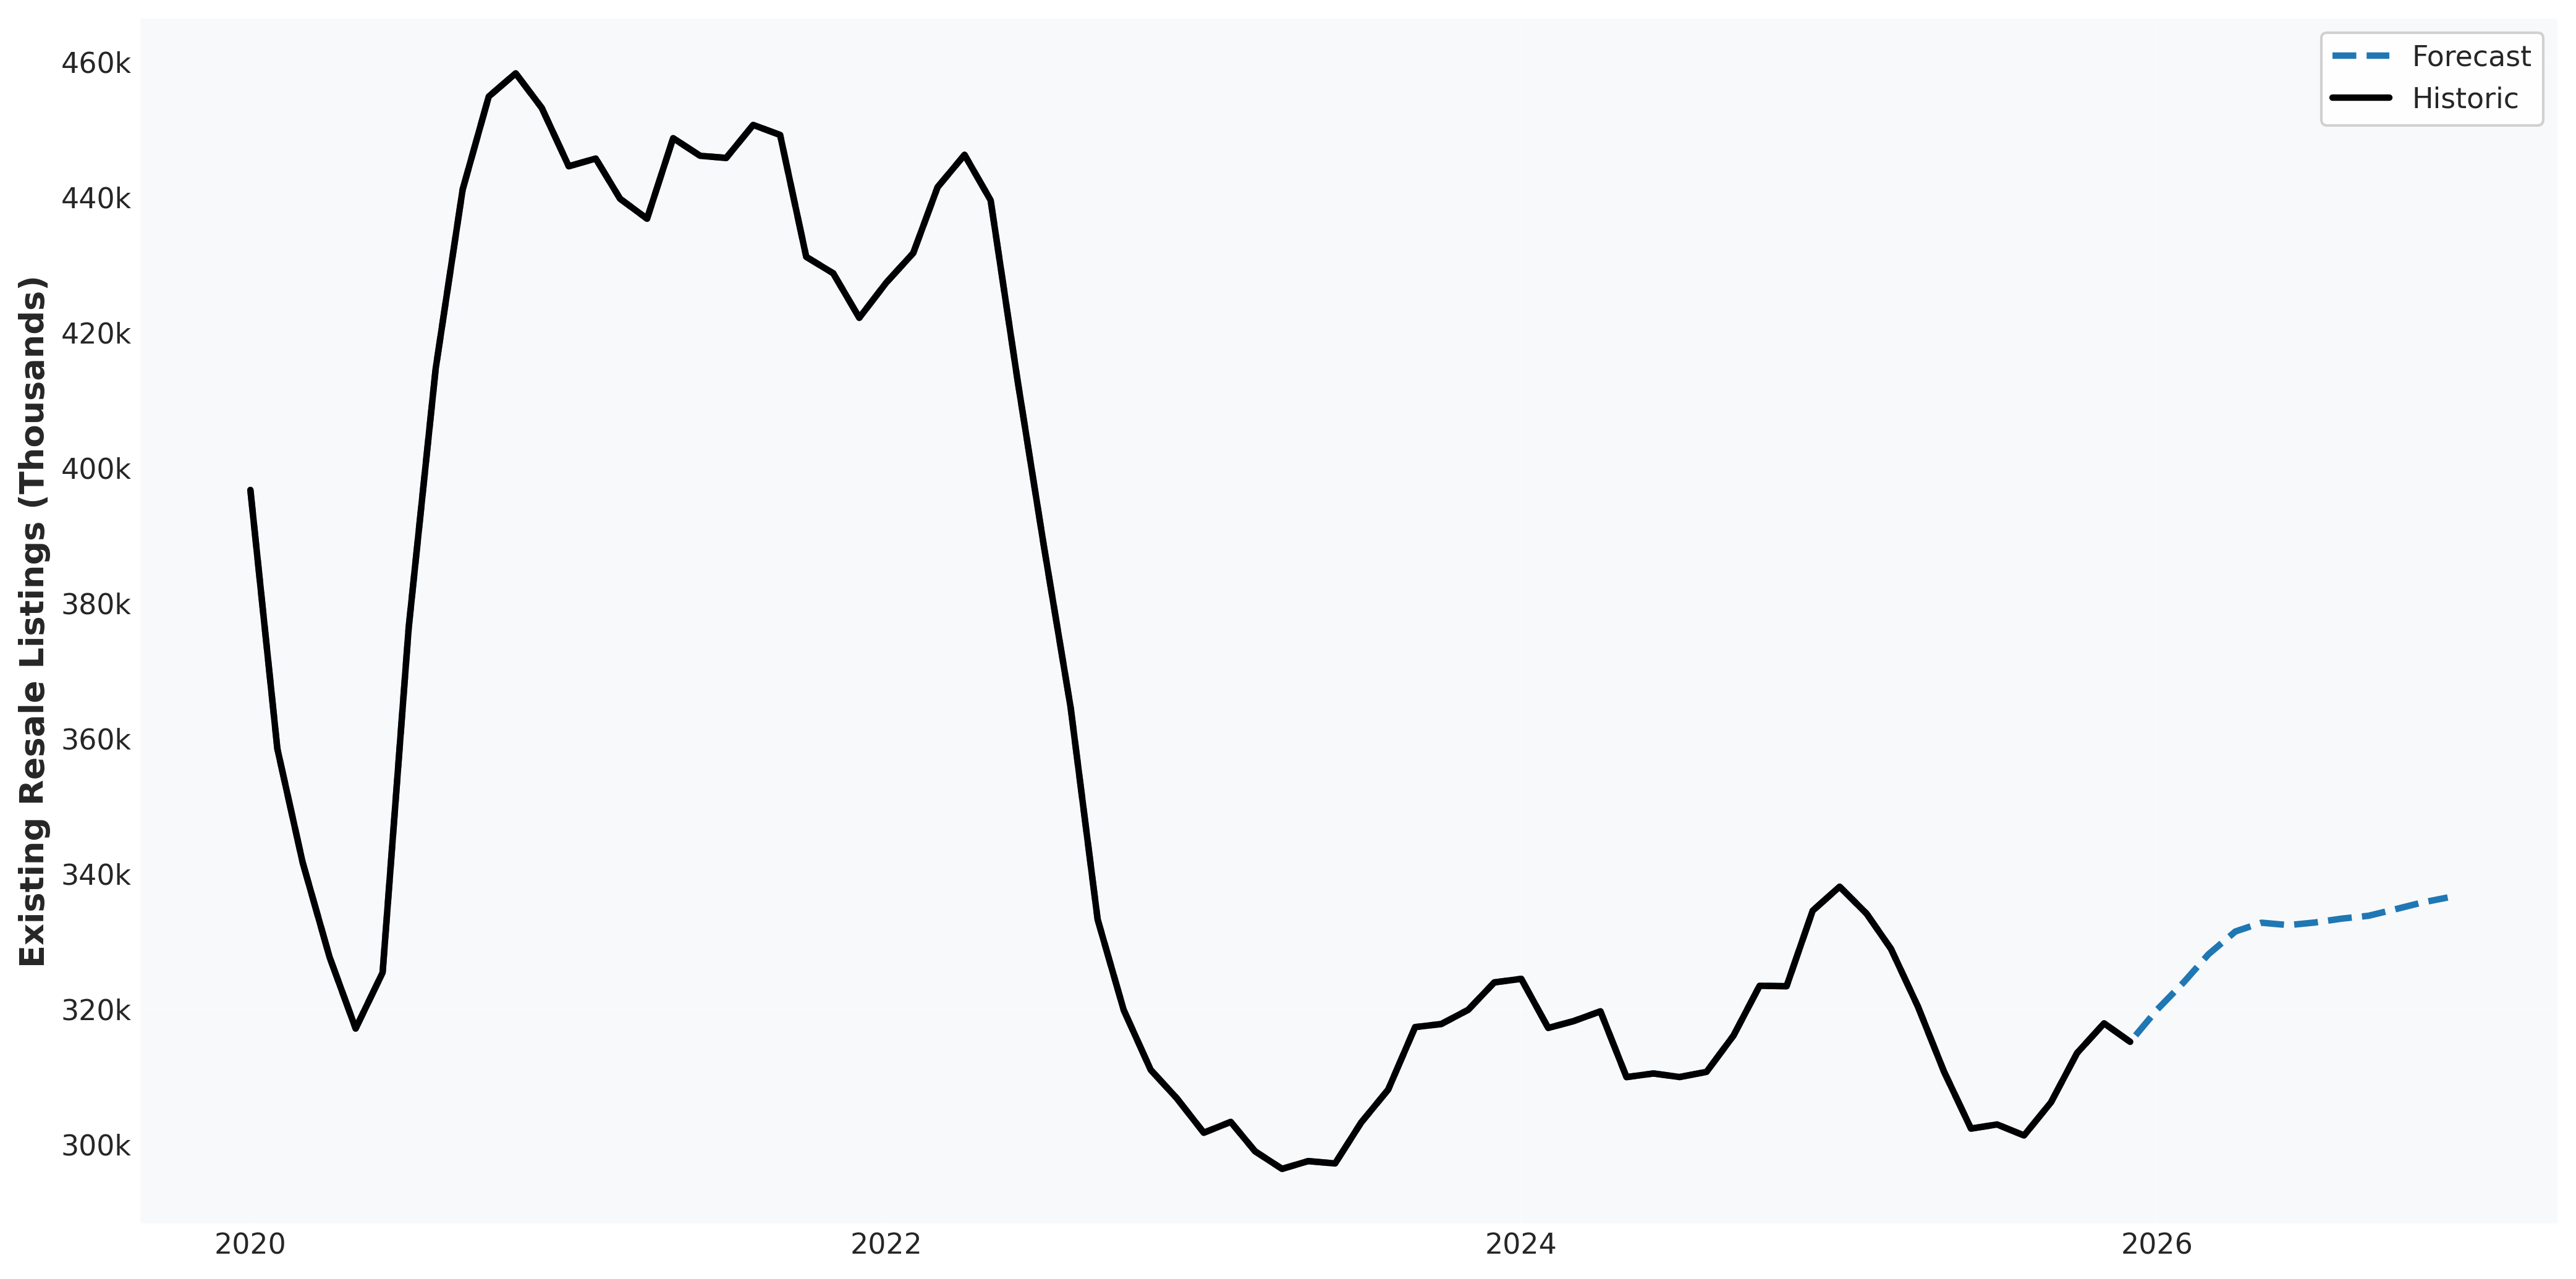
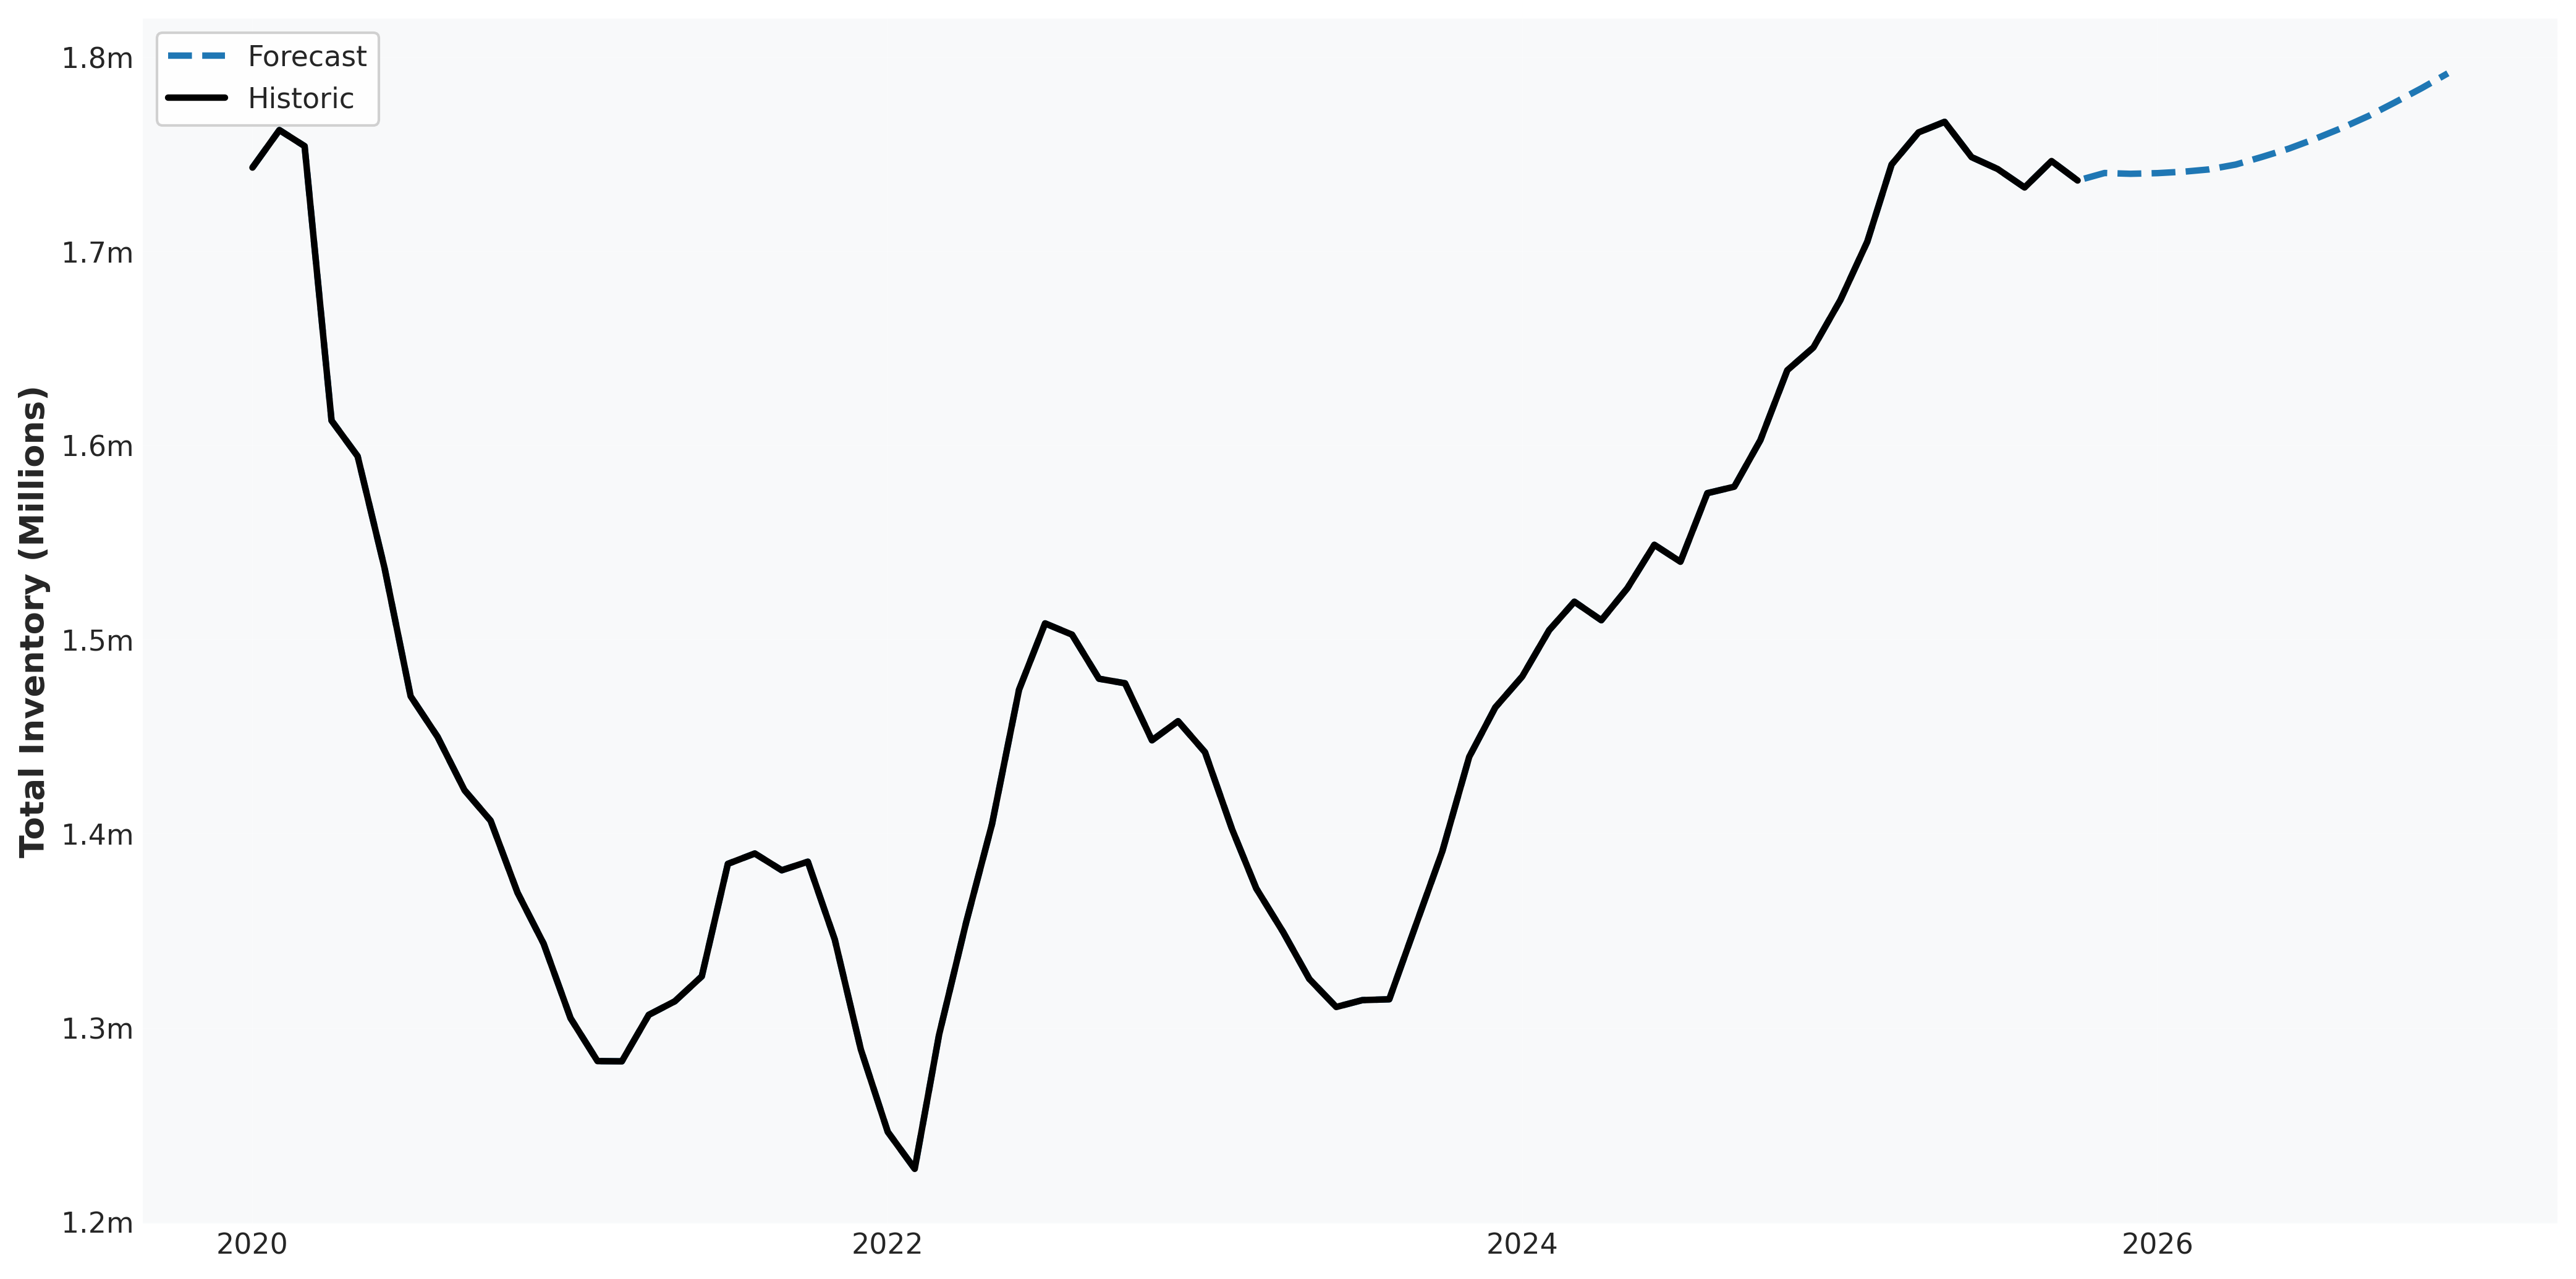
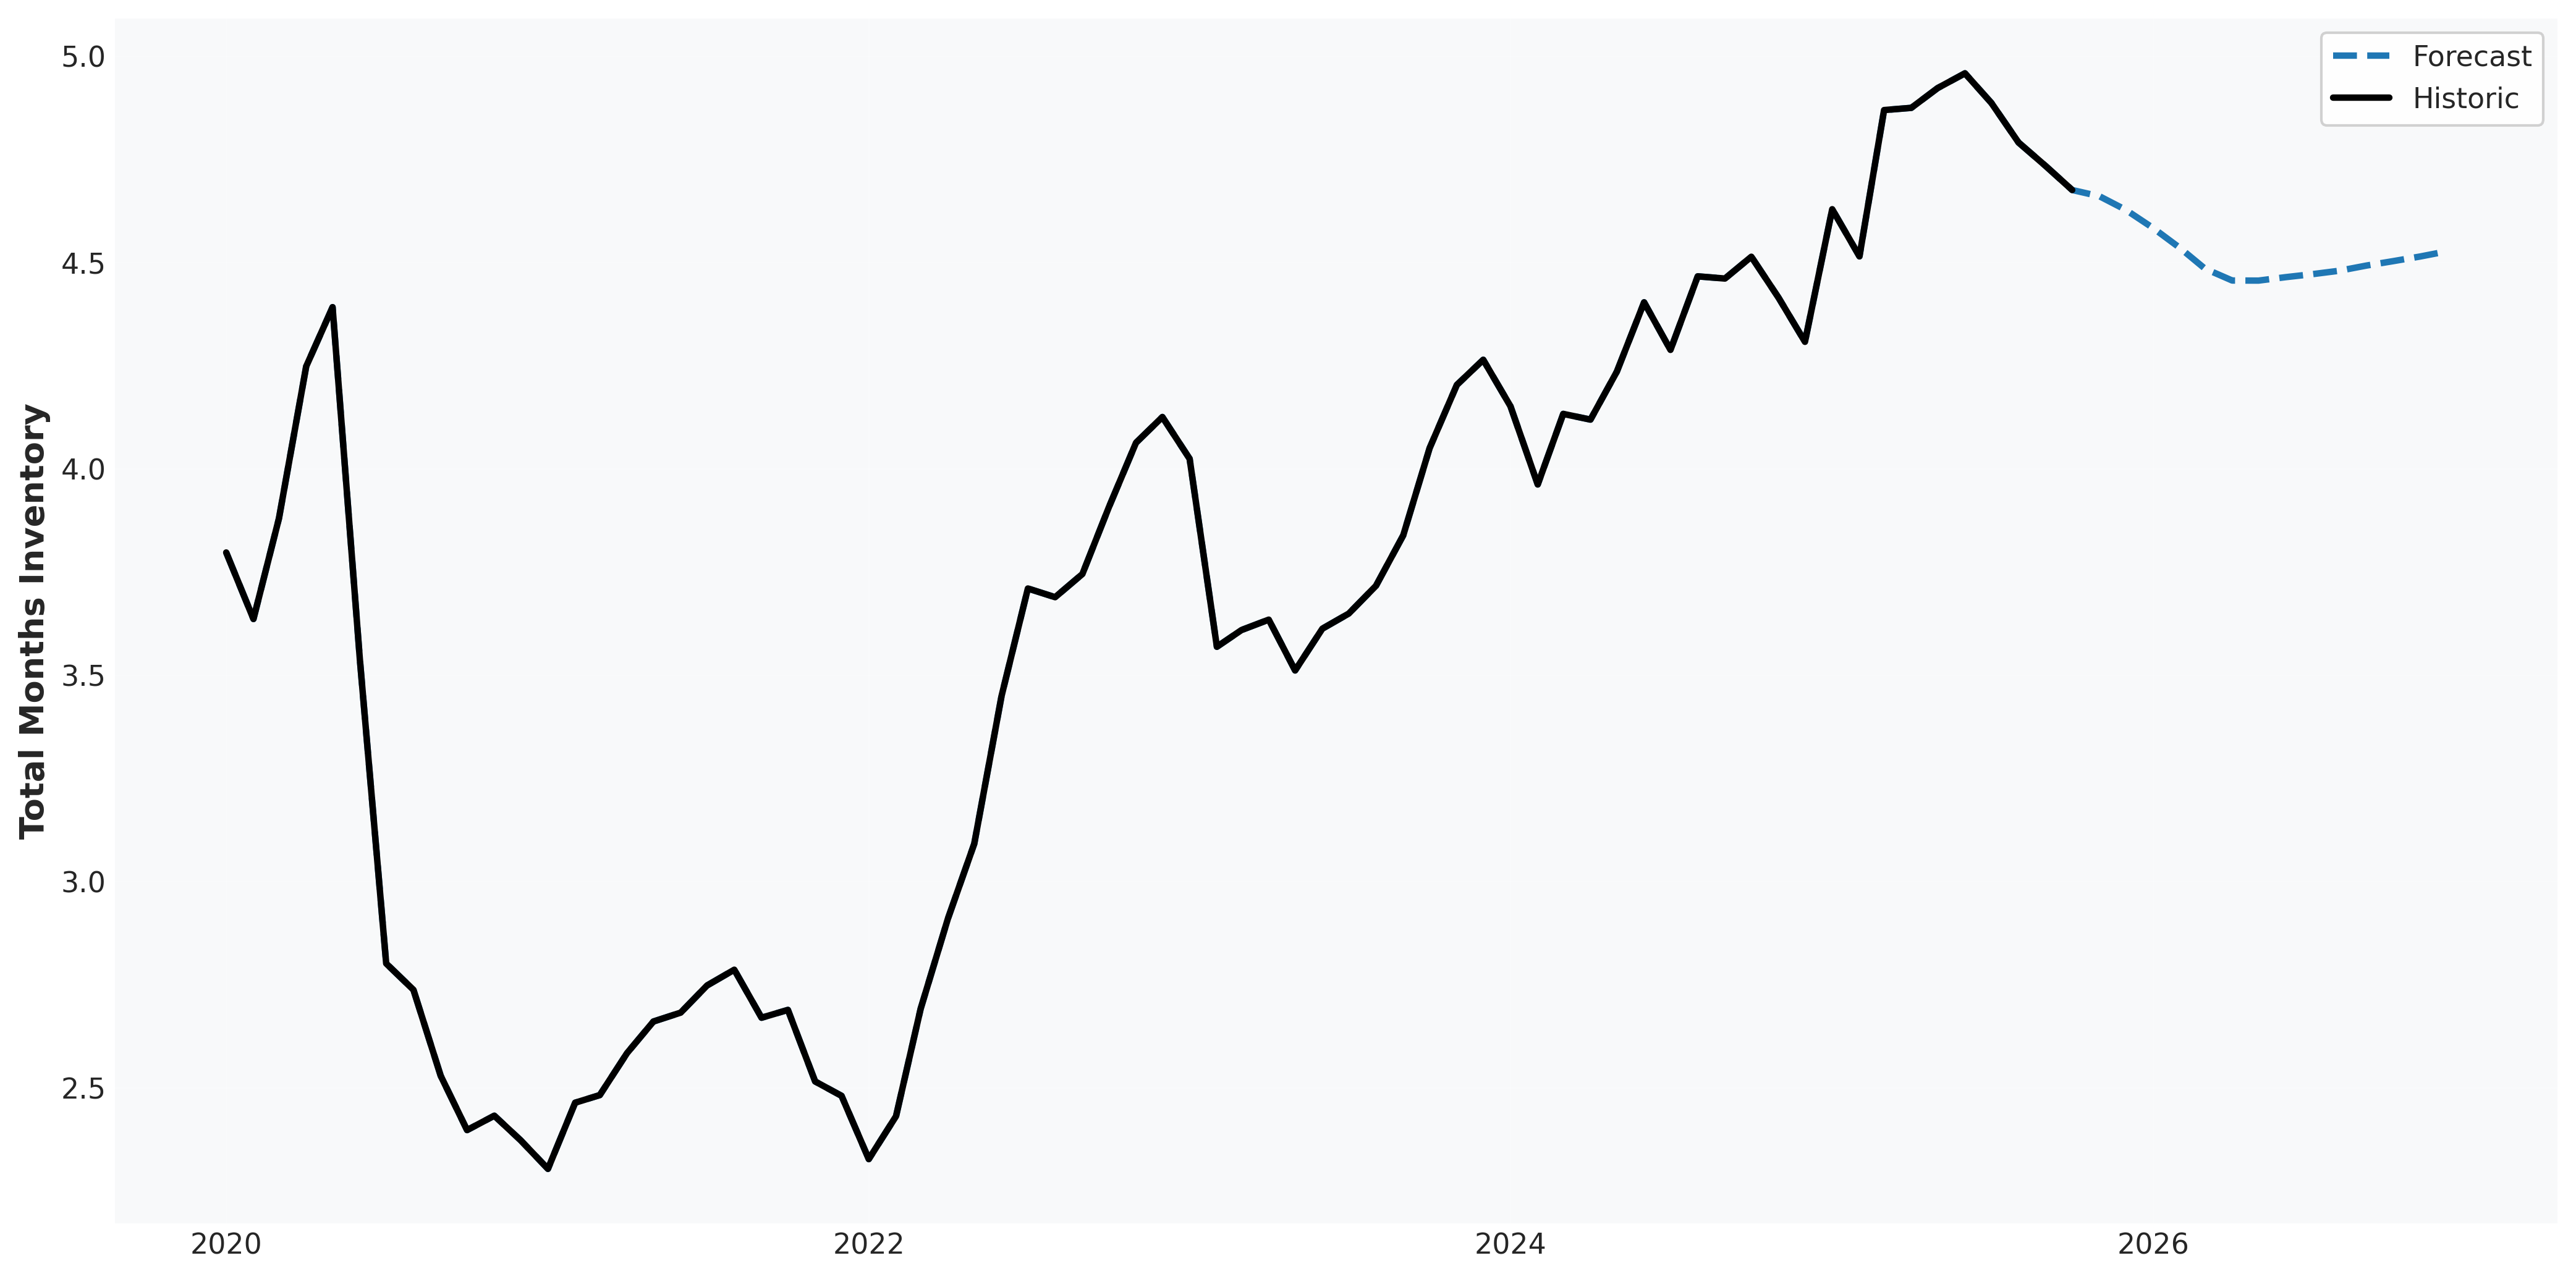
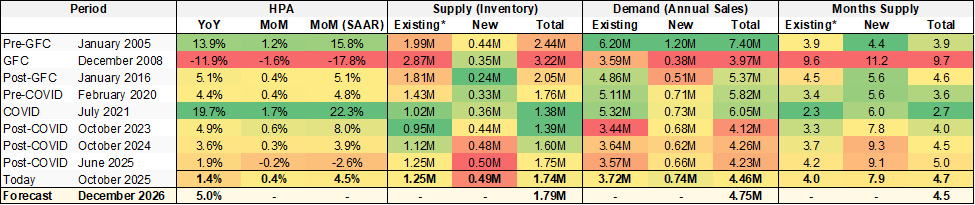 * Note: Existing inventory is seasonally adjusted for consistency with the other metrics.
Explaining the Drivers of the Current Housing Market
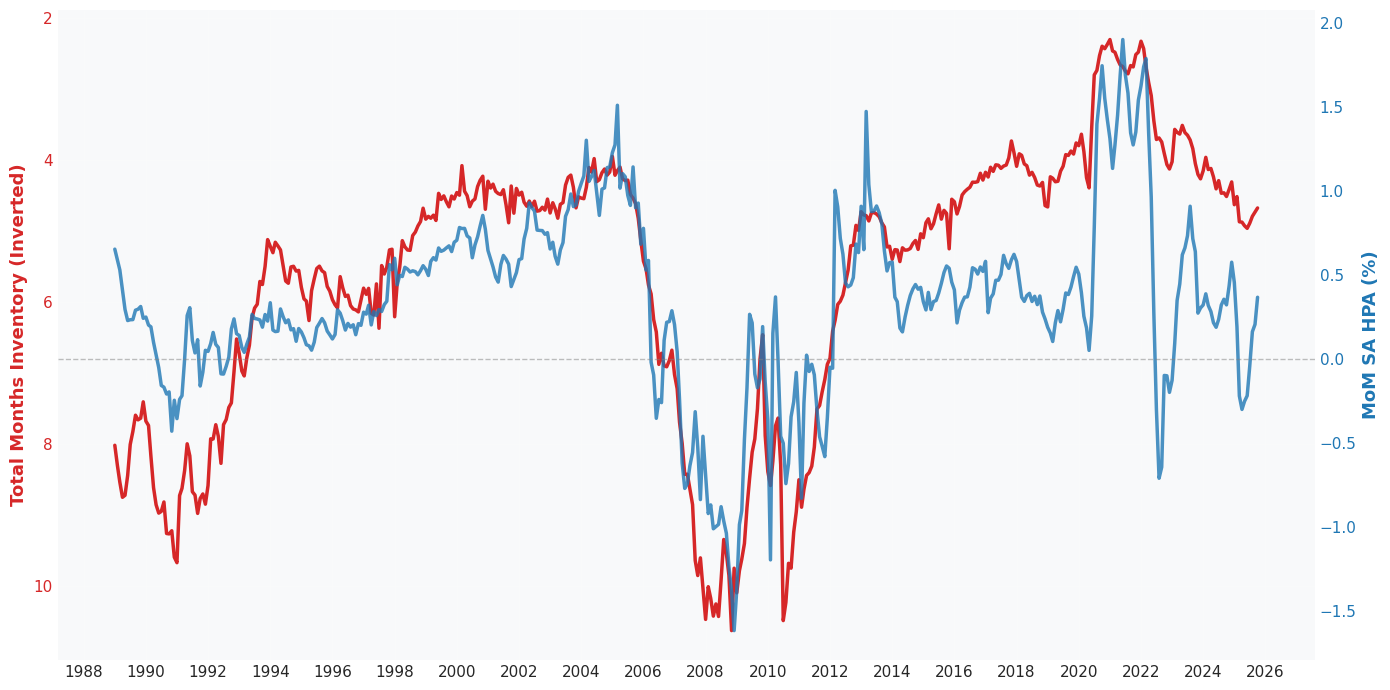
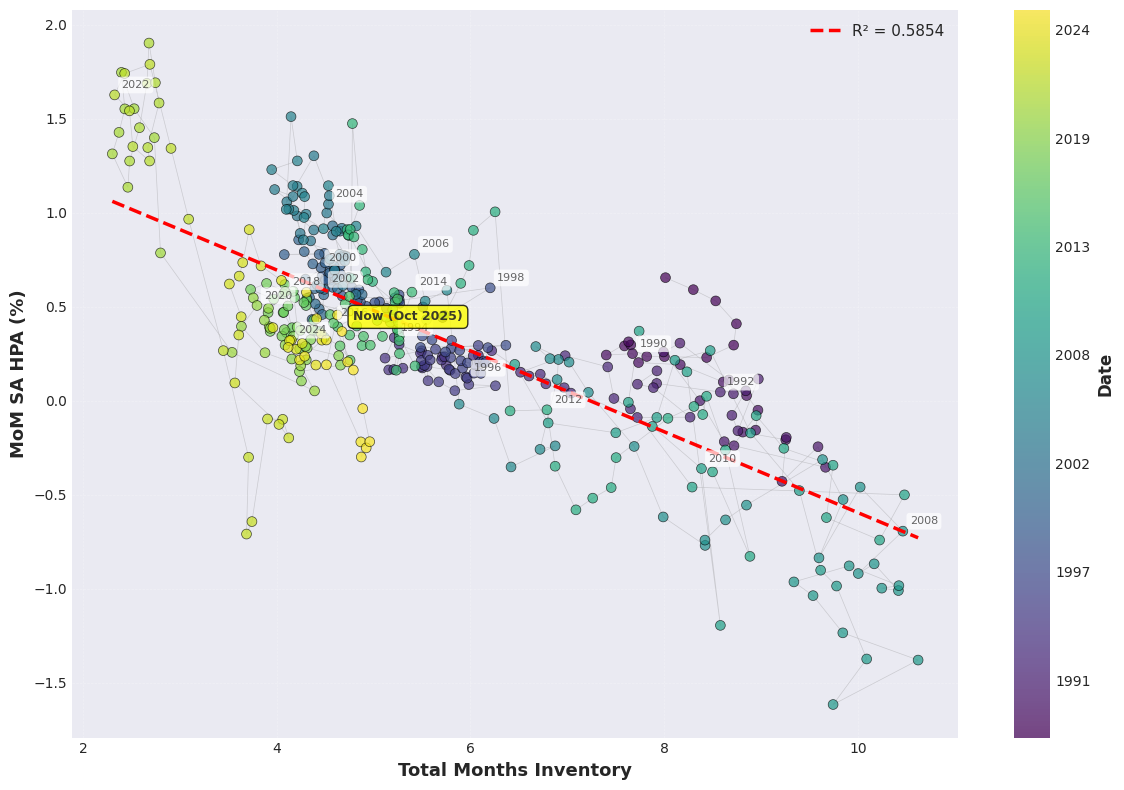
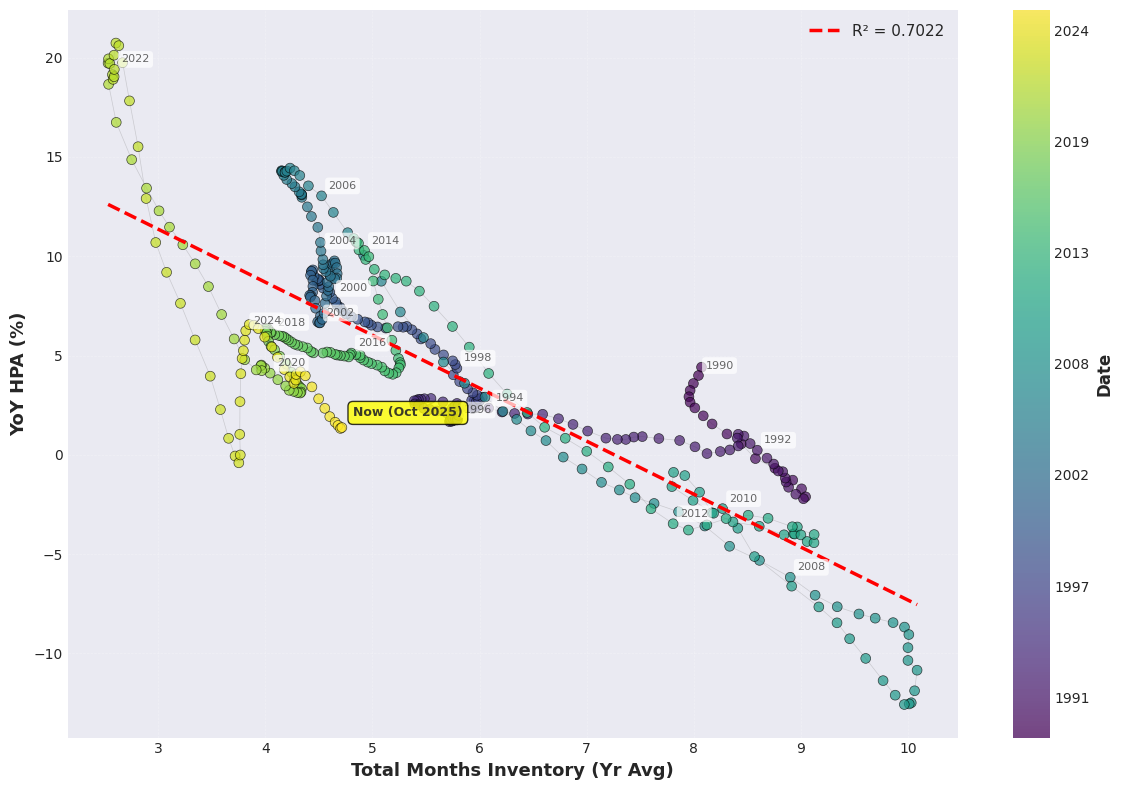
Movement in home prices has historically been well explained by measures of supply and demand. Because levels of home inventory/sales can decently proxy supply/demand, the ratio of total (existing + new) single family inventory to sales has historically correlated strongly with home appreciation. This is illustrated in Figure 2, where months of inventory is compared to HPA over time, and in Figures 3 & 4, where the two series are plotted across axes to demonstrate the linear relationship.
With this relationship understood, a breakdown of the sub-components of total months inventory elucidates a clearer explanation for HPA:
The primary drivers of these components are:
- Total Sales (Existing + New) $\leftarrow$ Mortgage Rates
- Resale Listings (Existing Inventory) $\leftarrow$ Mortgage Rates
- Housing Starts (New Inventory) $\leftarrow$ Trailing HPA
This conclusion is powerful as it allows for HPA projection purely in terms of mortgage rate movement within standard economic regimes (excluding GFC). The following sections justify this conclusion and discuss what this means for home prices going forward.
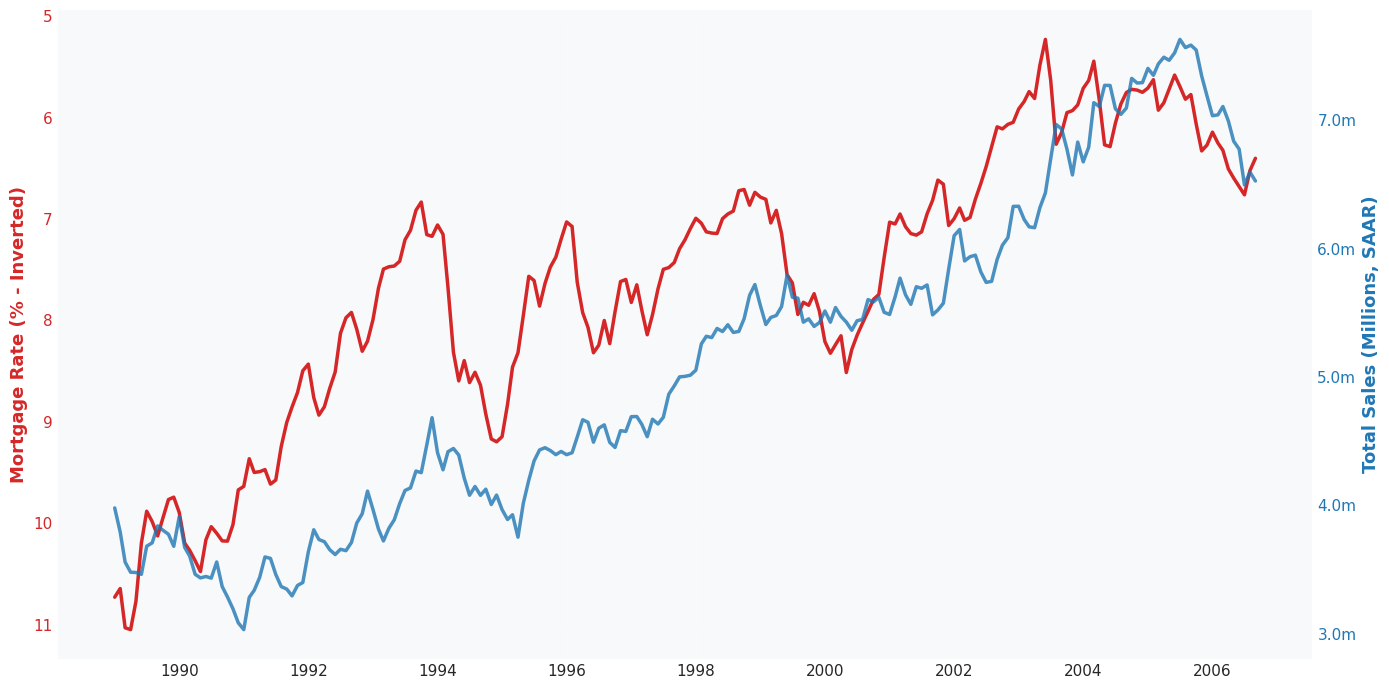
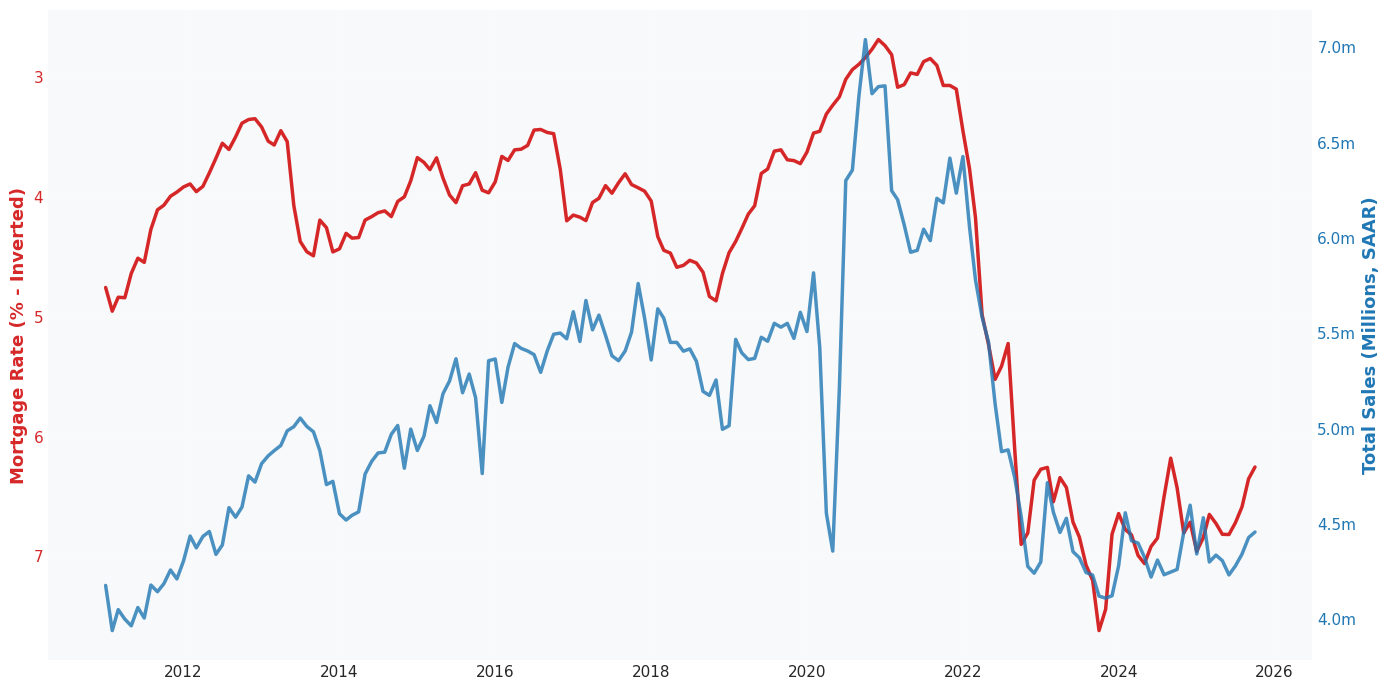
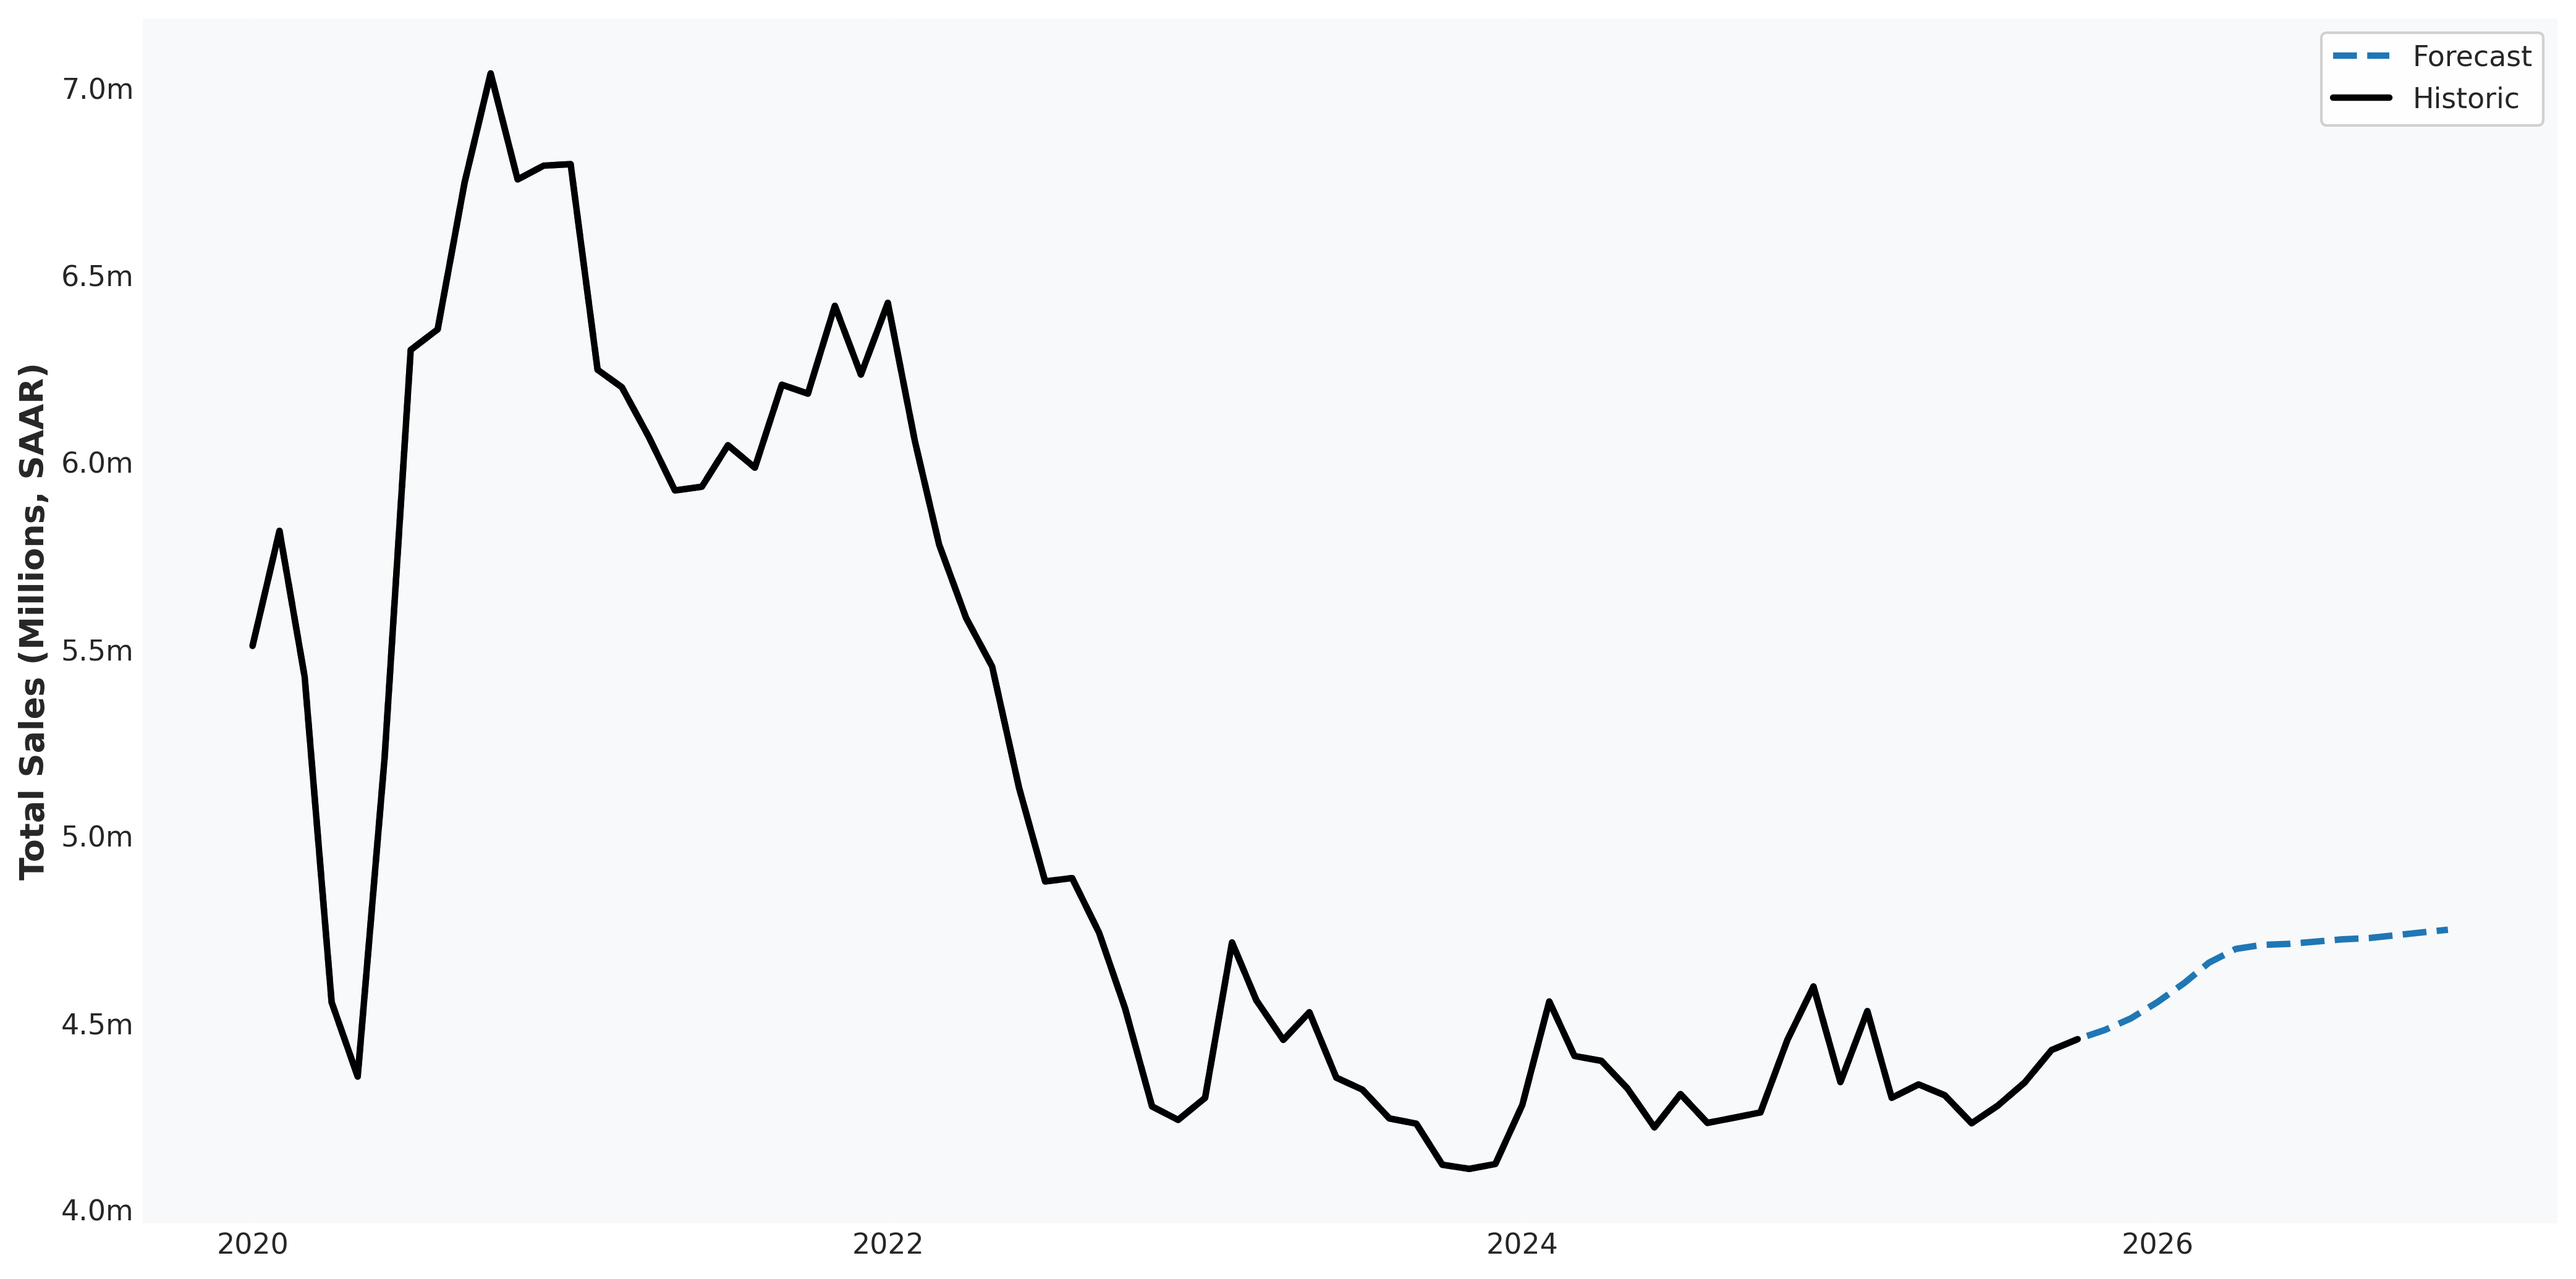
Total Sales vs. Mortgage Rates
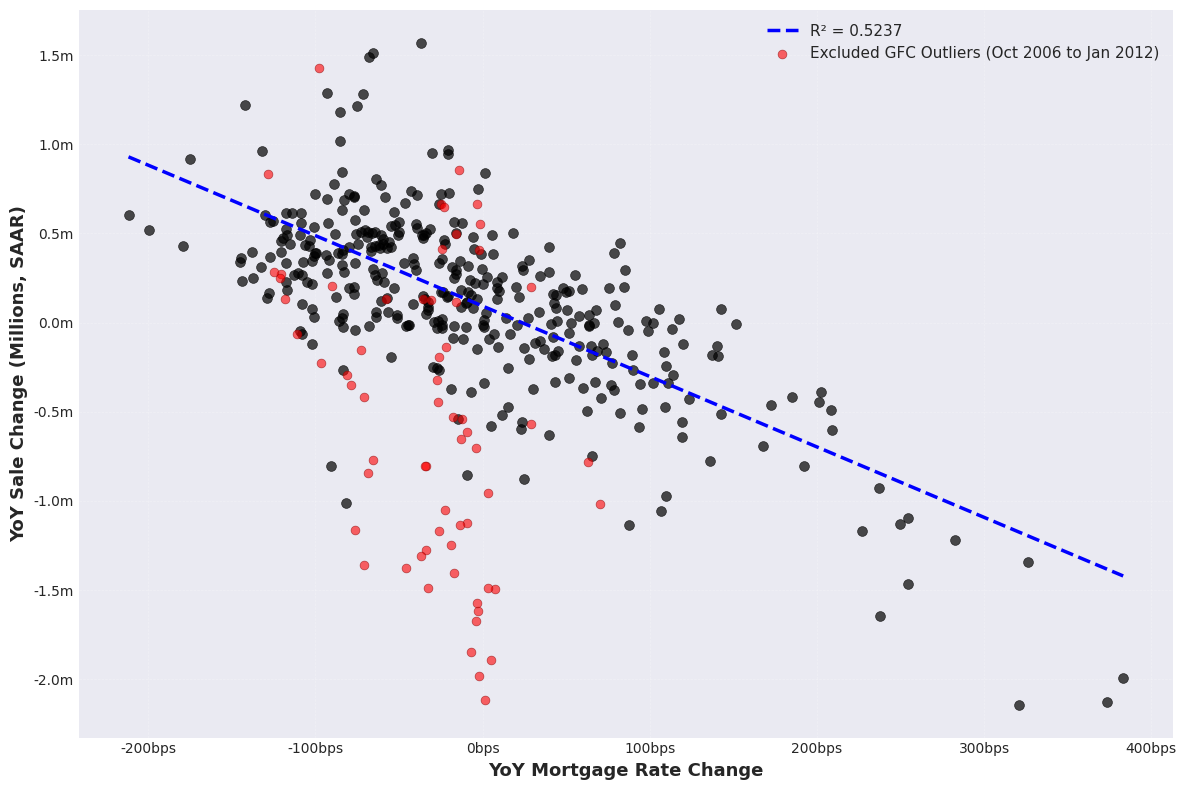
The biggest driver of home sale volume has generally been mortgage rate levels, with the recent dampened sale levels directly corresponding to the ~450bp rise in rates during 2022-2023. This makes sense as higher mortgage rates correspond to higher monthly payments, which strain affordability and reduce the economic benefit of home ownership relative to renting. Since 1989, the directional correlation has been relatively consistent (illustrated by Figures 5 & 6), with an exception during the GFC (Figure 7) when there was a break and reset in the relationship as the overall housing market collapse wiped out sales independent of rate movement.
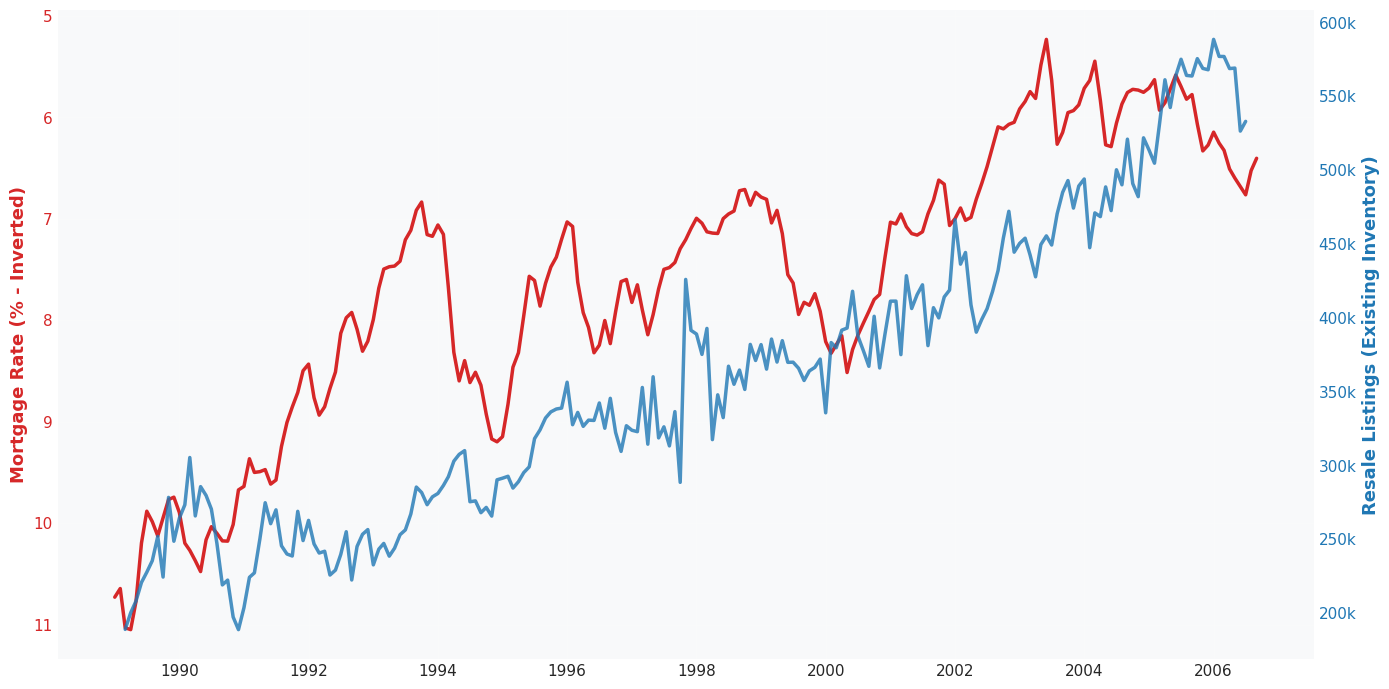
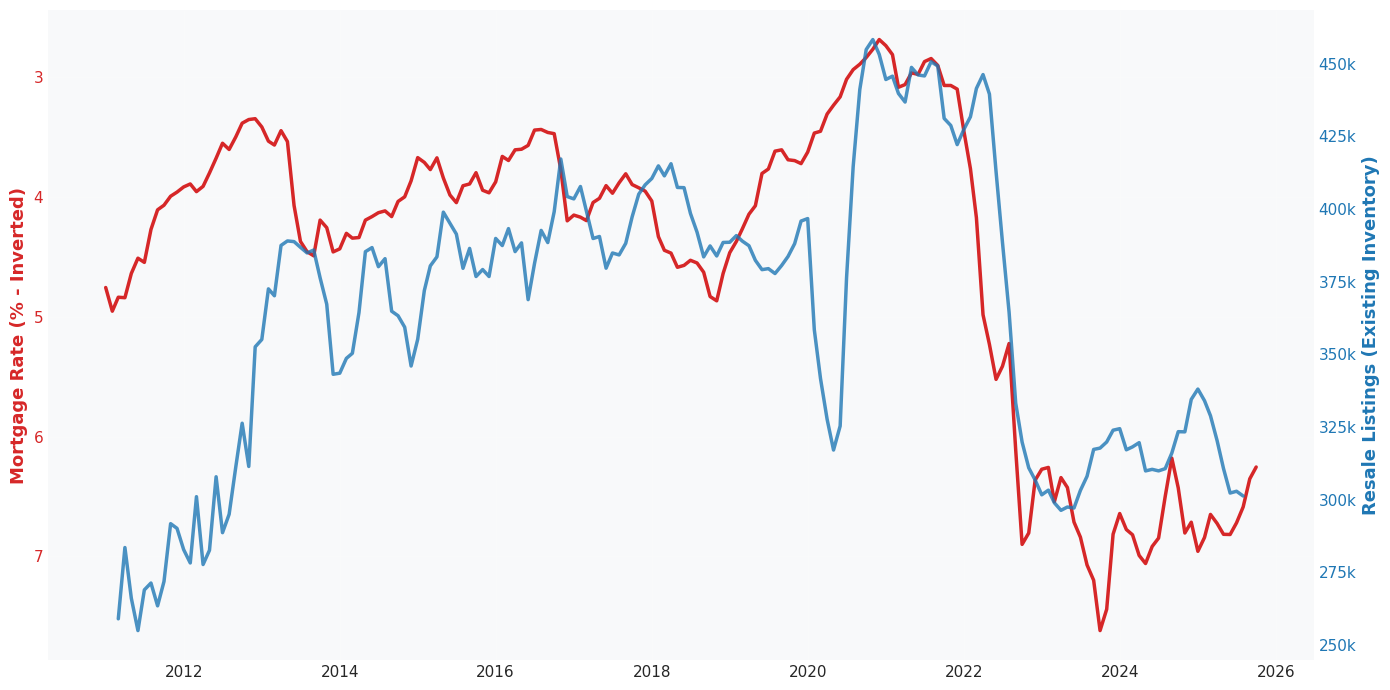
Resale Listings vs. Mortgage Rates
The catalysts for homeowners to list their home for sale largely overlap with the catalysts to buy, meaning that mortgage rate is the primary driver. Because the majority of home sales generally result in the seller purchasing a different home, this is logical. Furthermore, the lock-in effect of having an attractively low mortgage rate tends to make homeowners resistant to selling their home and losing the rate. Figures 8 and 9 show that the relationship between mortgage rate and new resale listings is similar to the relationship between mortgage rate and total sales established in the prior section.
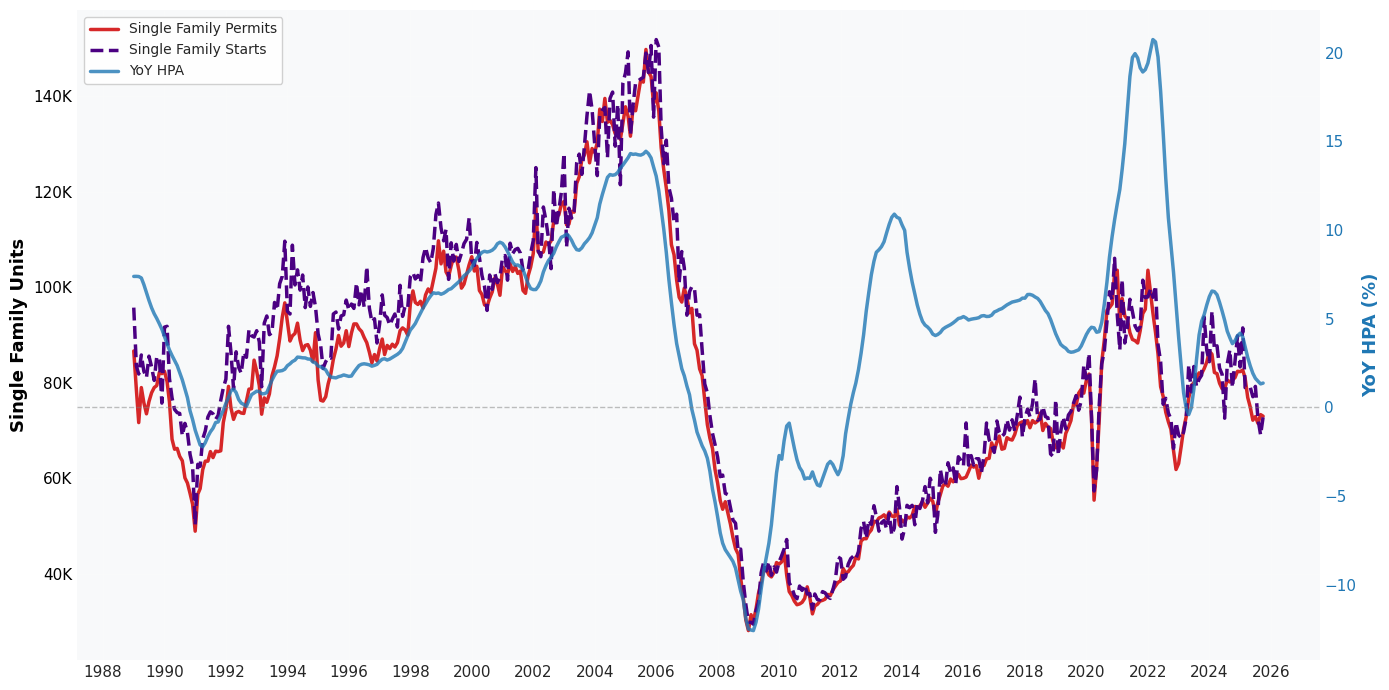
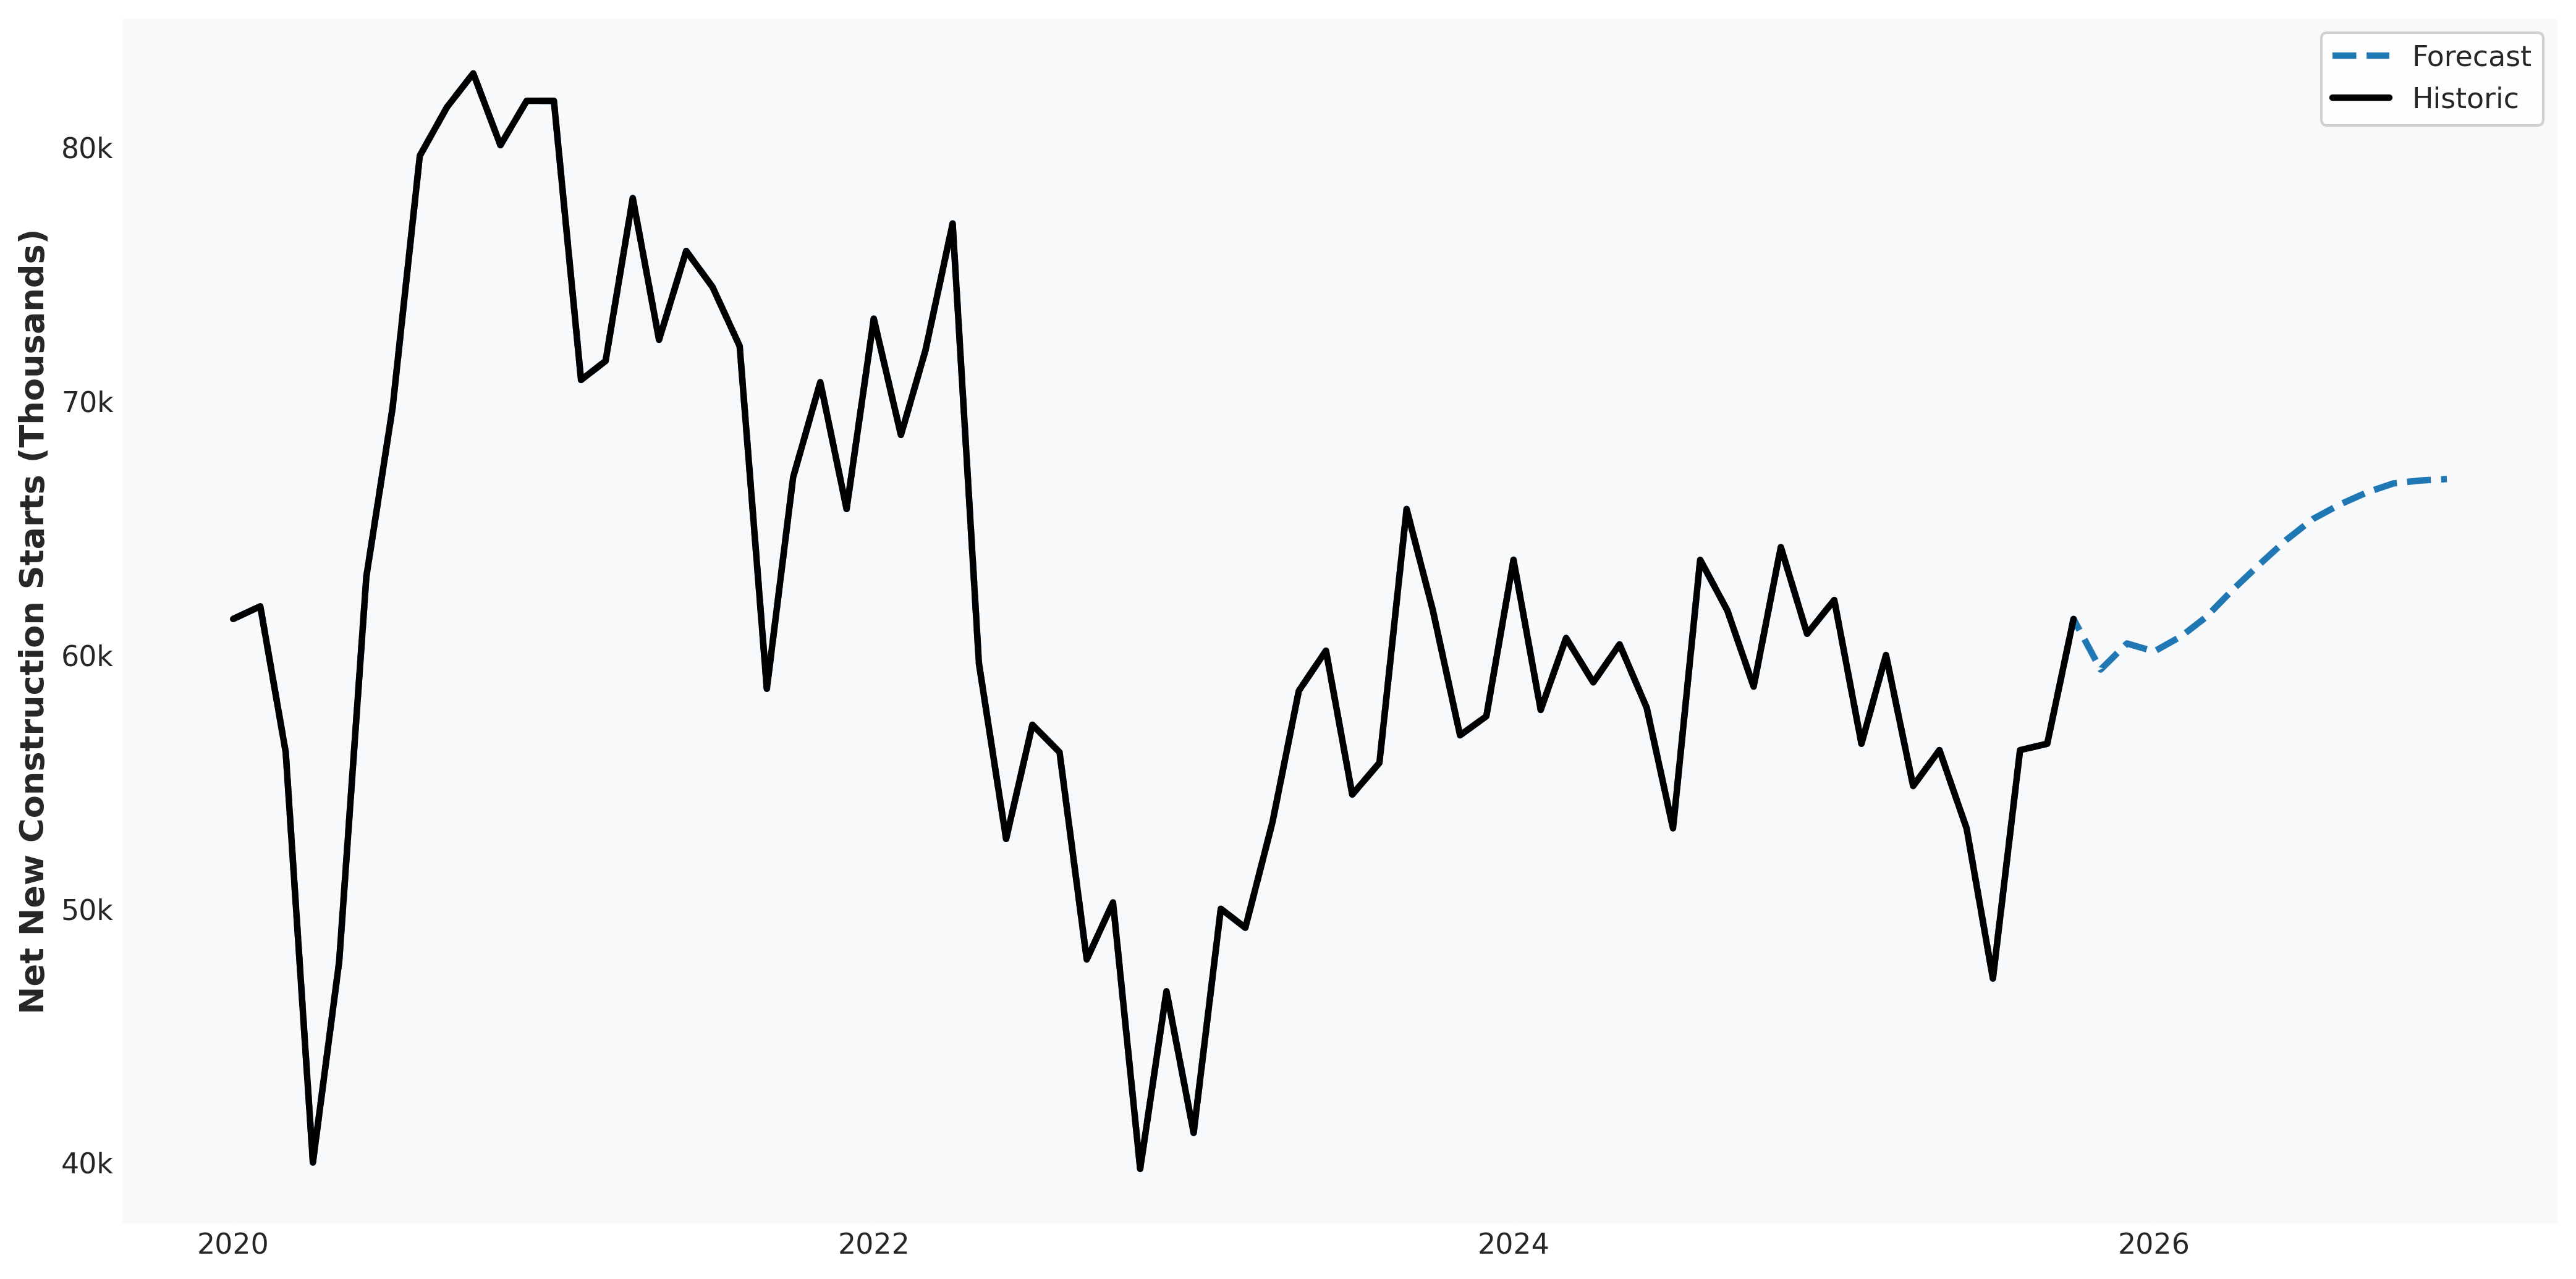
Housing Starts vs. YoY HPA
Because the economic viability of starting a new home construction project is so tightly tied to home price appreciation, it can be seen in Figure 11 that the volume of projects started is reactive to the appreciation felt over the last year. This graph also supports what many housing experts have asserted for years: the aftermath of the GFC has hindered construction levels and created a supply shortage that has driven elevated HPA for years.
How This Explains Post-COVID HPA Dynamics
In the years following COVID, we've seen these relationships described play out:
- Mortgage rates up ~450bps $\rightarrow$ Total sales down ~40%
- Mortgage rates up ~450bps $\rightarrow$ Resale listings down ~40%
- Trailing HPA from COVID above 20% annually $\rightarrow$ New starts up ~40%
Sales falling paired with an influx of new construction have pushed total months supply up from a COVID low of 2.3 to 4.7, correspondingly lowering HPA levels from above 20% to the current annual level of 1.4%.
What Does This Mean For Home Prices Going Forward?
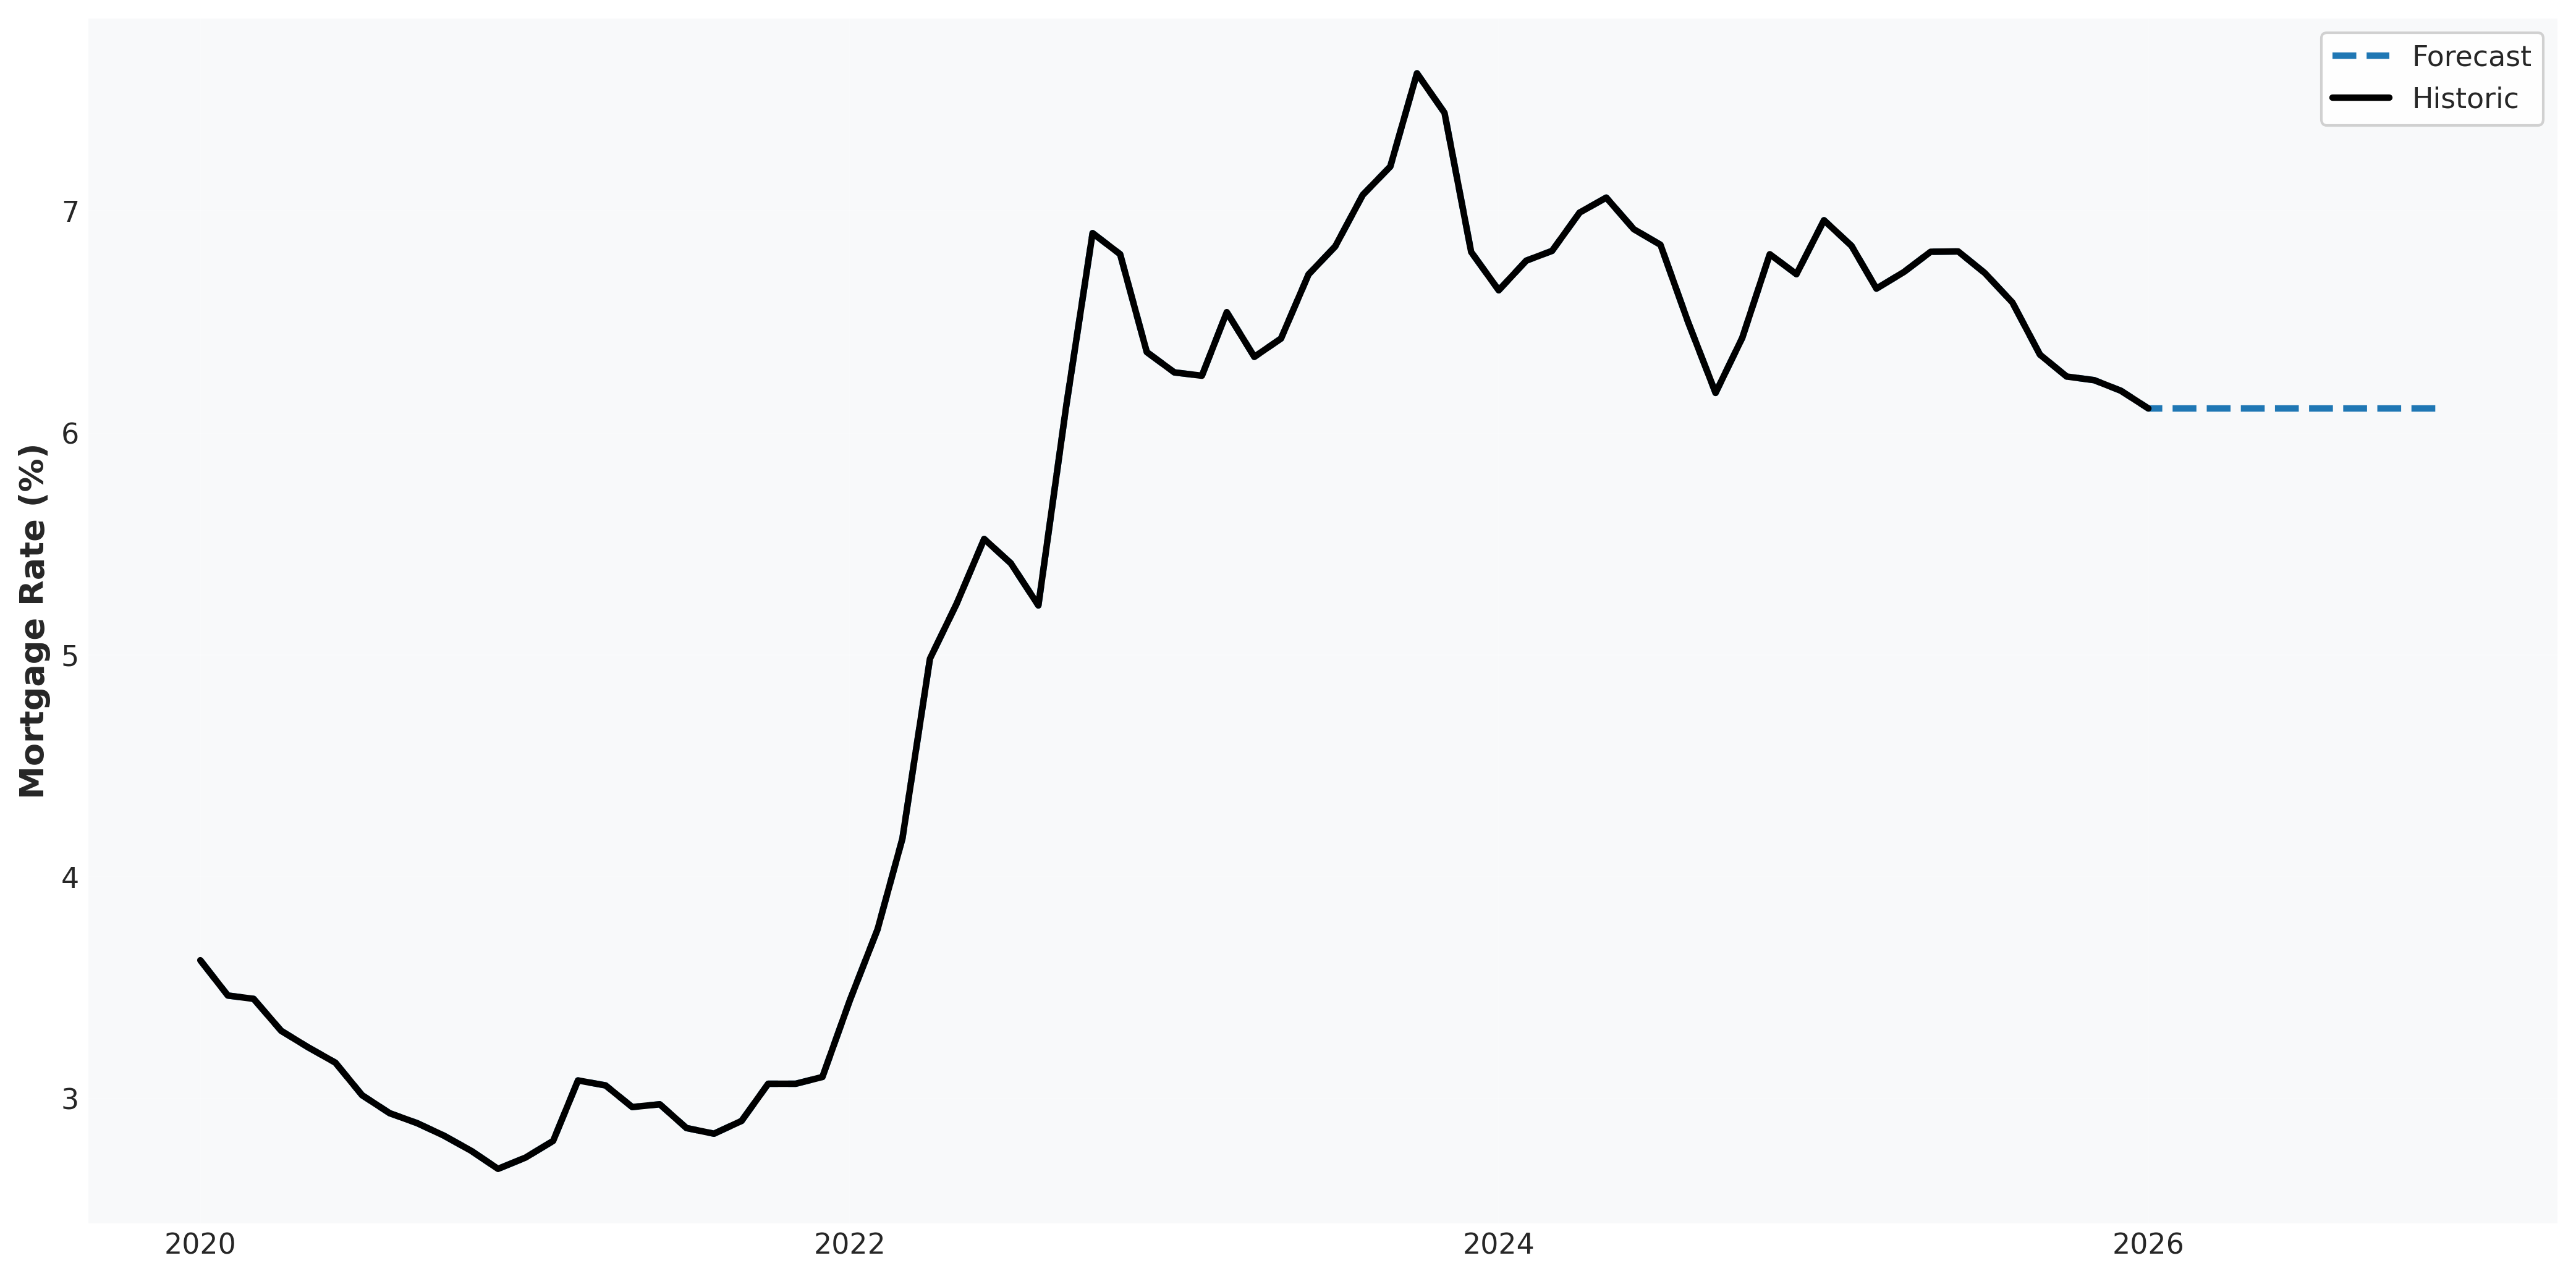
The consensus research expectation for 2026 is that mortgage rates will be flat around 6% and HPA will stay in the 0-2% range. Using the assumption of flat mortgage rates, the relationships described in previous sections can be applied to simulate HPA for 2026 and support a higher 5% estimate.
Under a flat rate scenario, mortgage rates will be the lowest since 2022. This should cause a pickup in sales that is more significant than the rise in resale listings and new construction starts, bringing the overall months of inventory number down. With this, there should be an increase in HPA that nears 5%, potentially even passing that level.
In Figures 12-18, basic linear models were applied to each of the relationships discussed and run forward for 2026. The results align with the directional intuition for each series and provide a baseline estimate for what that could mean for home prices. Ultimately, this baseline suggests that the market's sensitivity to recent rate relief is understated, and a meaningfully positive appreciation target is backed by historical trends.