Despite homeownership being demonstrably responsible for immense wealth growth over the last 75 years, the recent environment of elevated mortgage rates paired with slowed HPA makes now one of the few periods where being a renter and investing the capital saved into other asset classes is generally more economically attractive.
Below we’ll explore the historical dynamics of renting versus homeownership and put forward a framework to estimate the investment returns of owning a home.
Evaluating 75 Years of Divergence in Rent and Home Prices
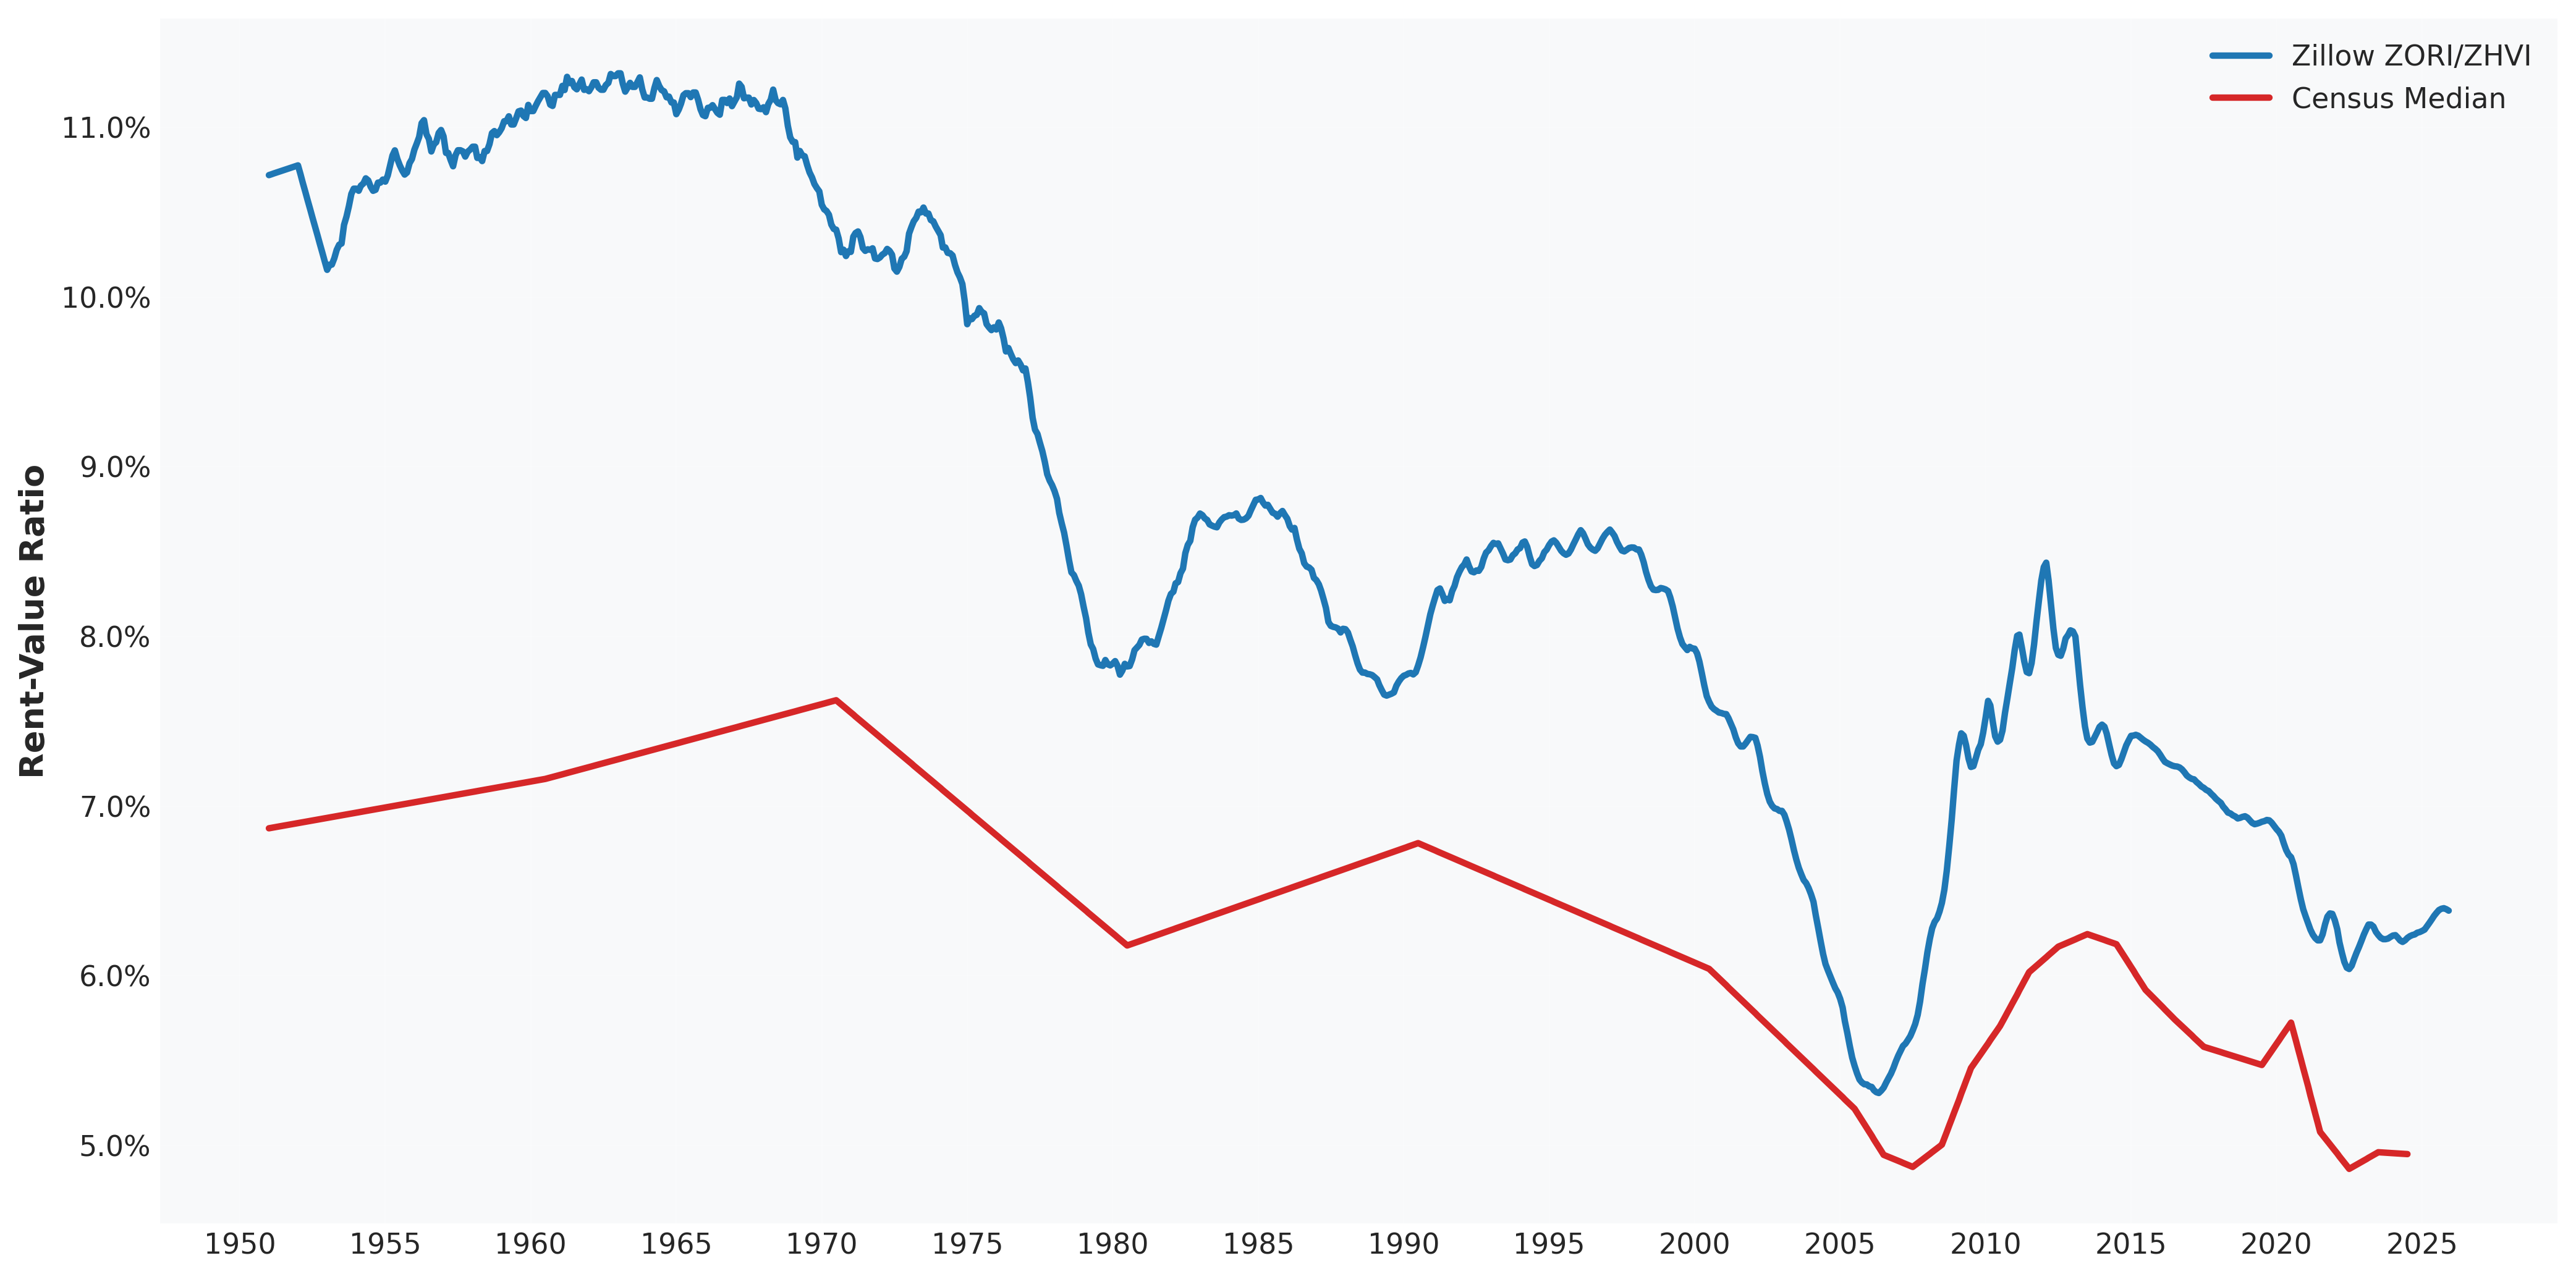
Home values have outgrown rent for most of the last 75 years. Figure 2 illustrates this trend using two rent-to-value estimates: (1) Census median rent versus median home value, and (2) Zillow Observed Rent Index (ZORI) versus the Zillow Home Value Index (ZHVI), with the pre-2015 segment backfilled with CPI Rent of Primary Residence and Case-Shiller HPI.
Causality for this trend has been debated, with rates discussed as one possible determinant. In Robert Shiller's Long-Term Perspectives on the Current Boom in Home Prices from 2006, he proposed that interest rates are not the explanation, and instead that "recent divergence between real interest rates and real rental-price ratios suggests the possibility of an irrational overpricing today and a huge fall in home prices in coming years". Figure 3 accompanies this point in the paper.
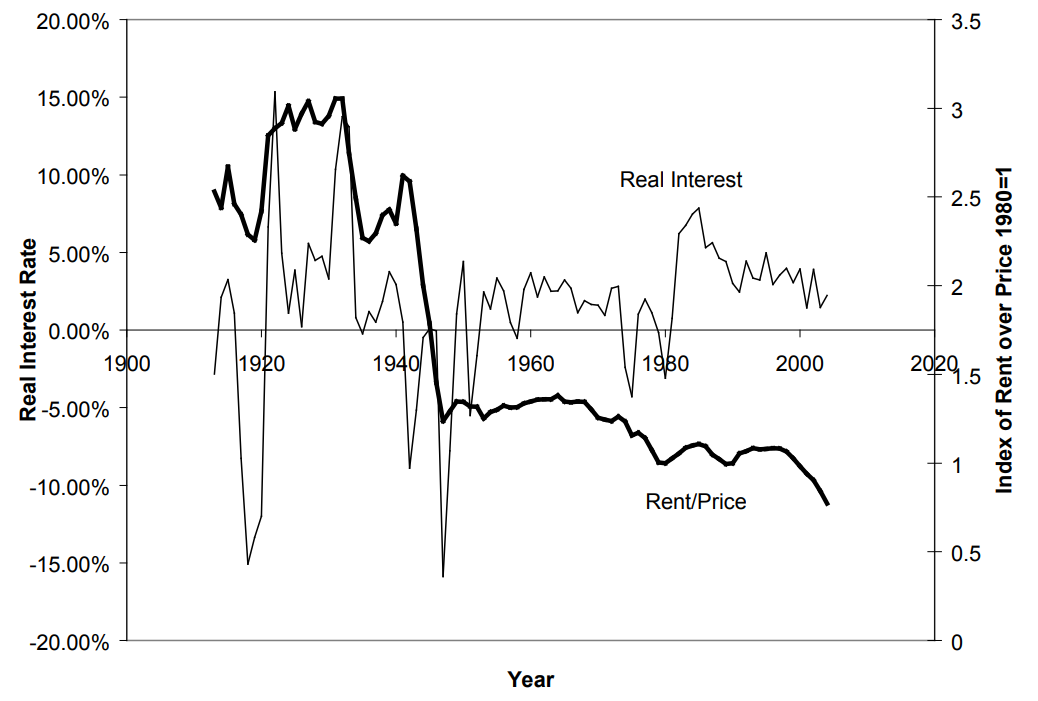
Figure 4 is the recreation of Figure 3 updated for the last 20 years. Shiller's stance on impending correction proved correct during the GFC, although the divergence in real interest rate and rent/price ratio has since returned to pre-GFC levels.
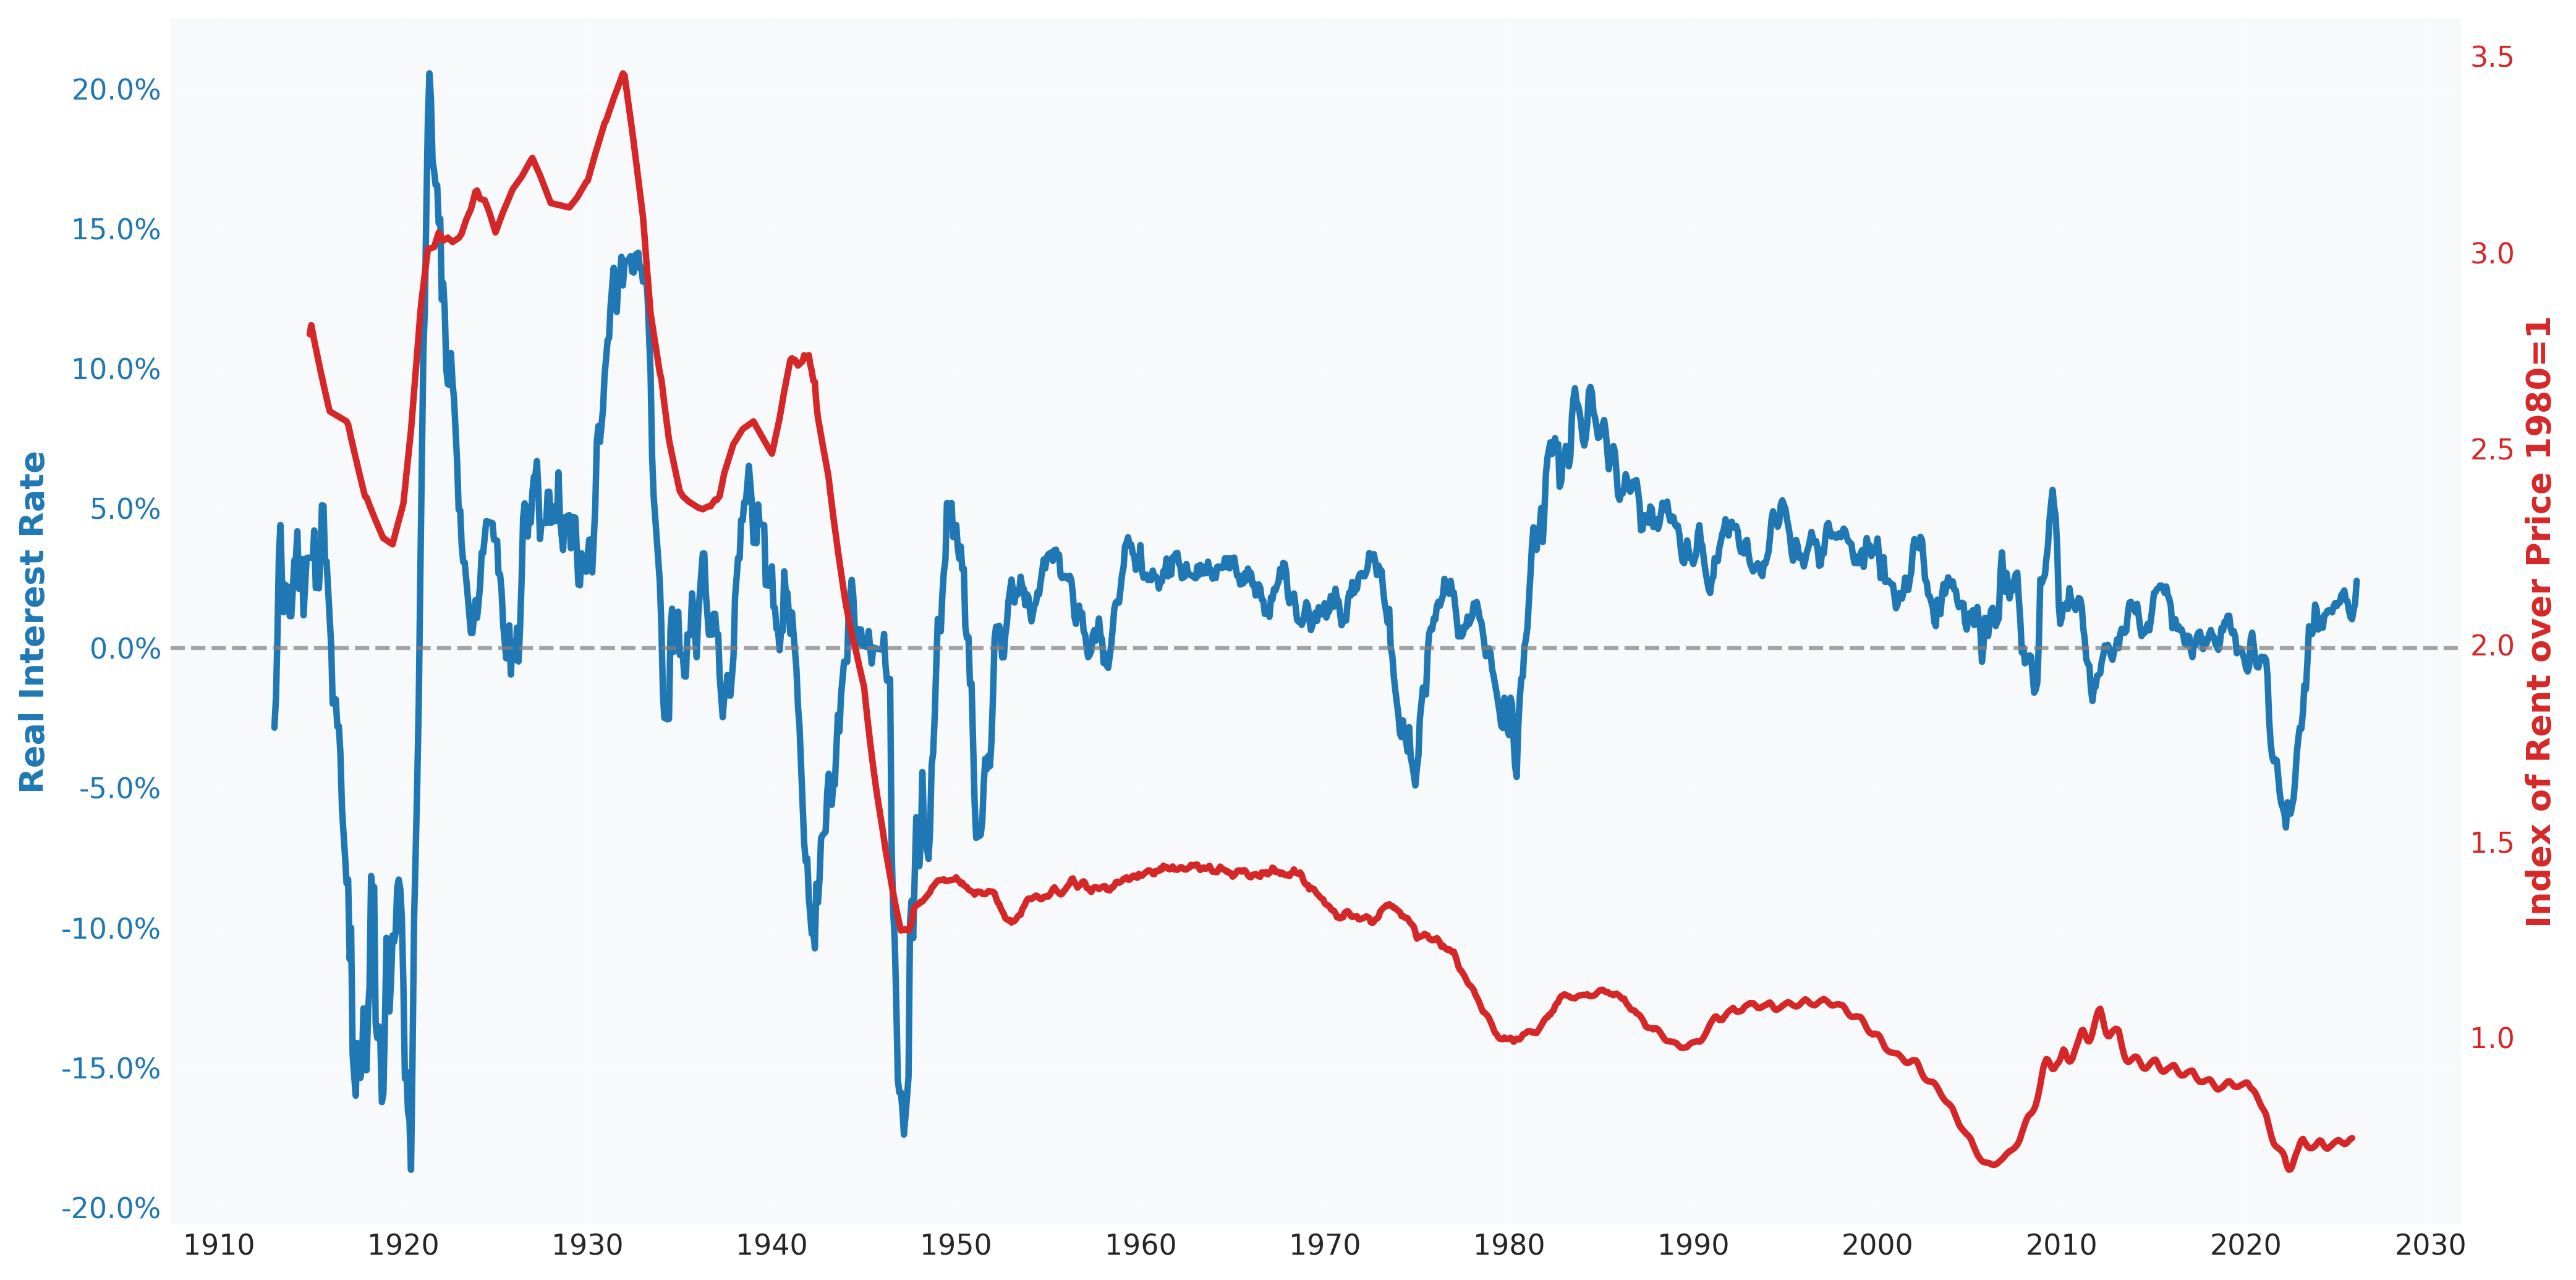
This sustained divergence in real interest rate relative to rent/price ratio impacts both the affordability and return on investment experienced by homeowners. We'll quantify this concretely by utilizing the Zillow ZORI/ZHVI series from Figure 2 and average mortgage rate levels.
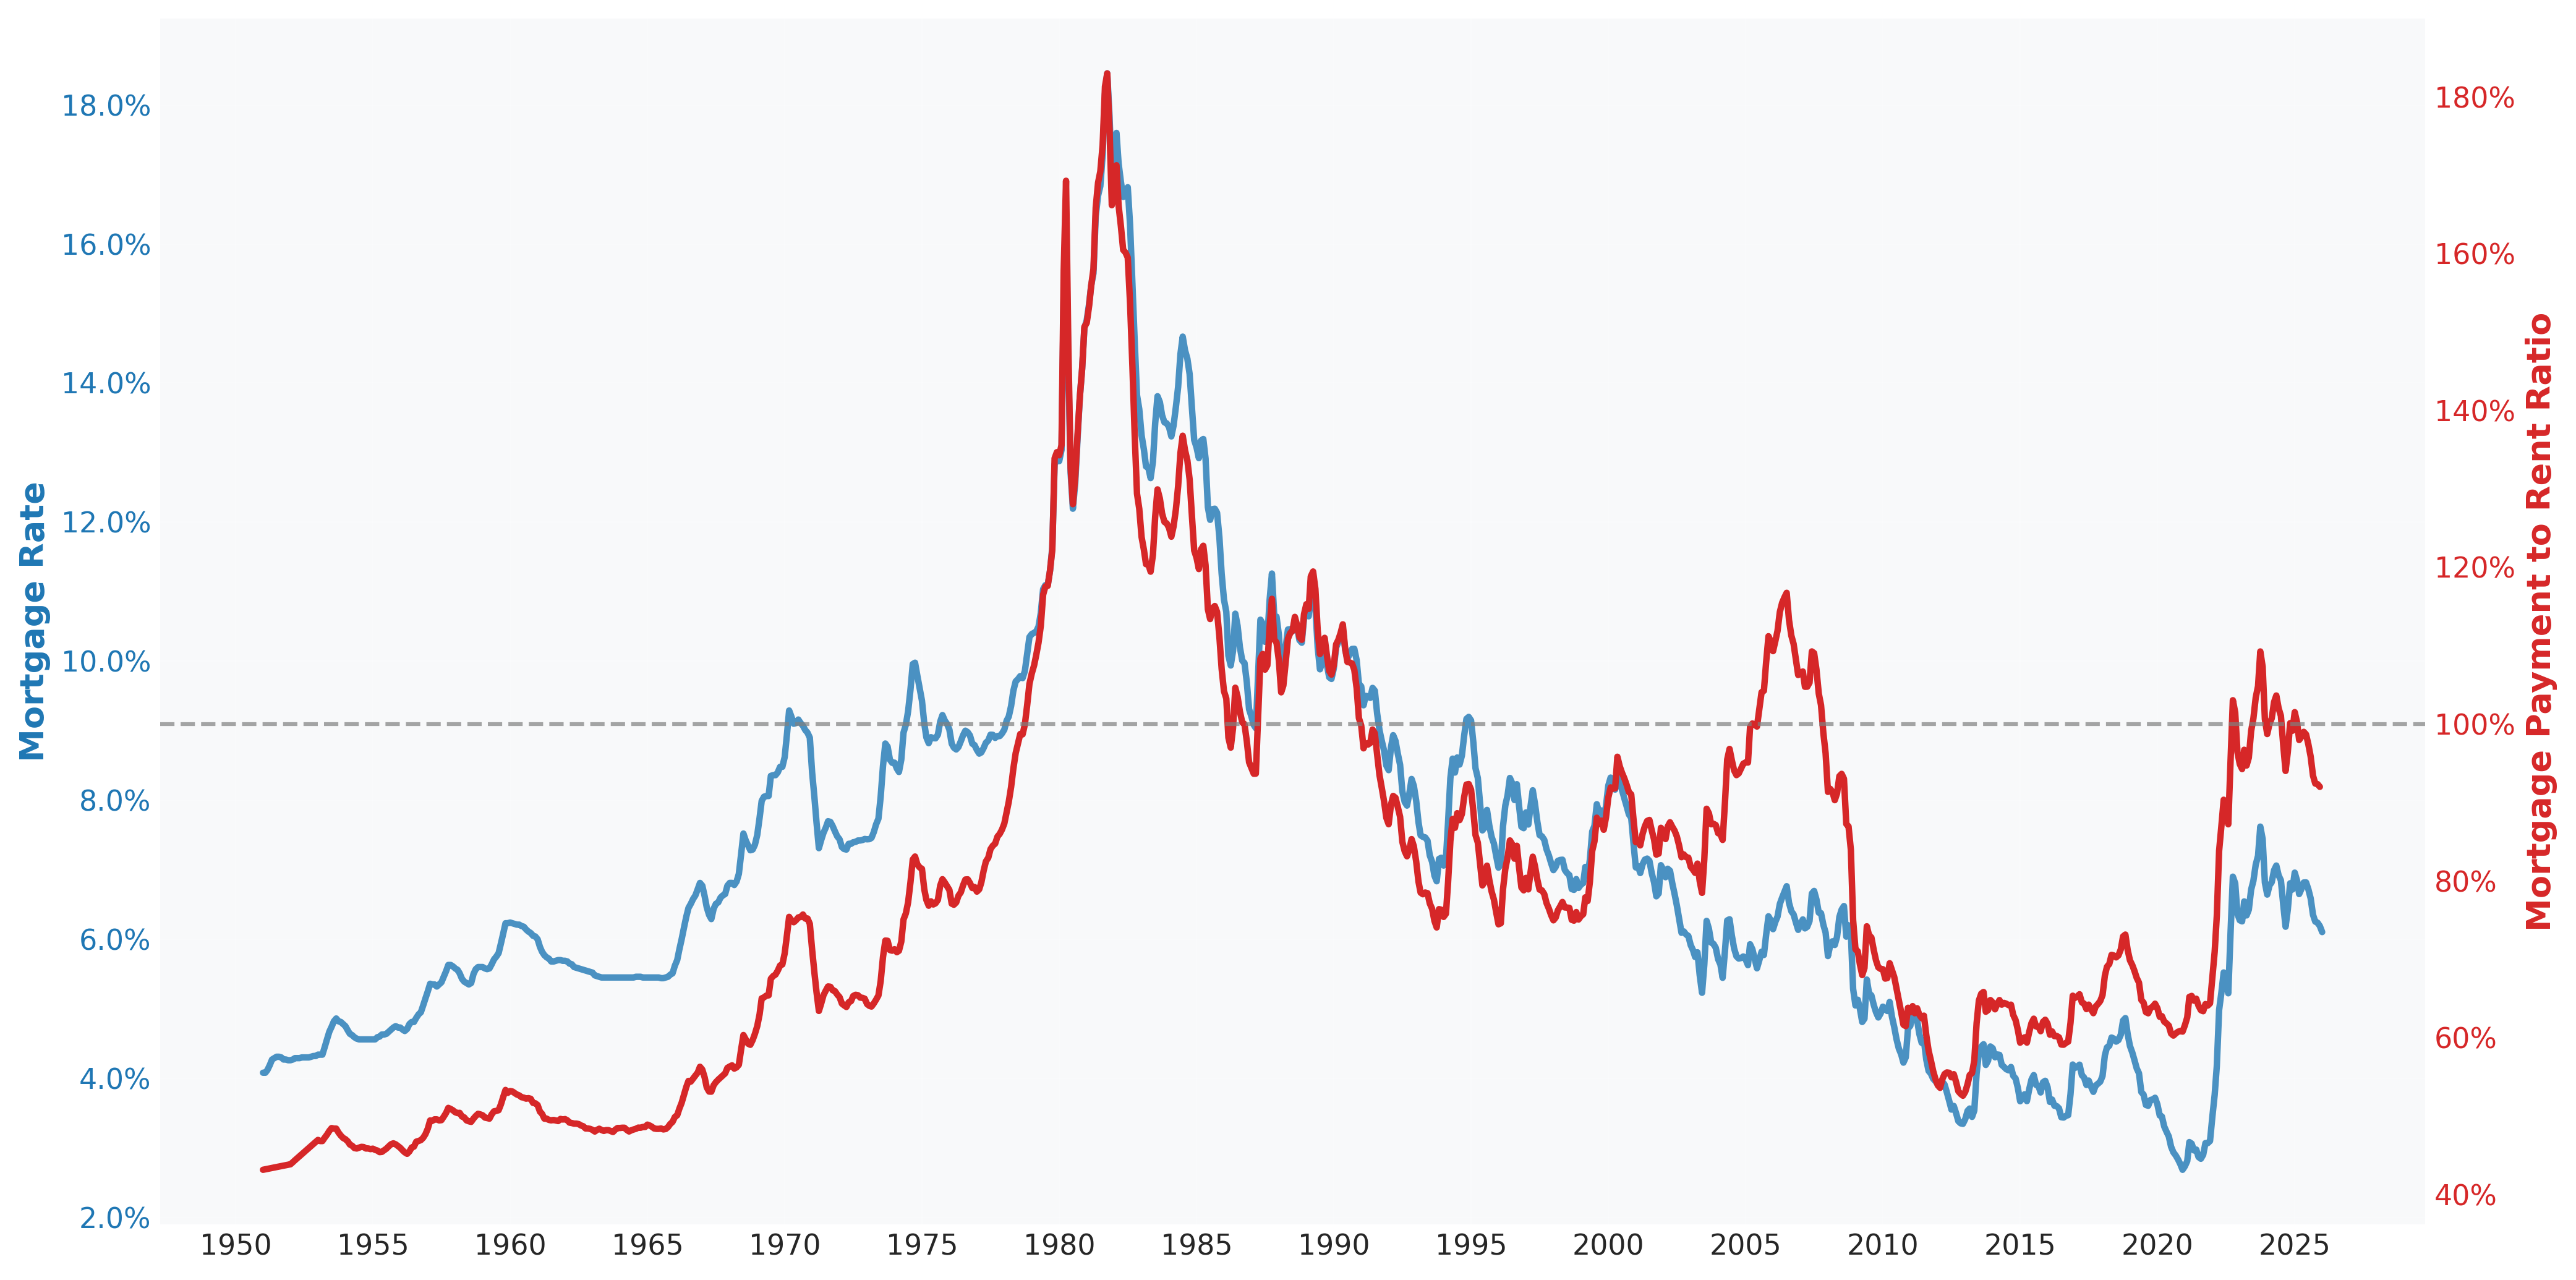
Under the assumption of a standard 30-year mortgage with market interest rate and 80% LTV, the rent-to-value index can be transformed into the mortgage payment to rent ratio illustrated in Figure 5. It can be seen that with mortgage payments currently scaling to 92% of rent levels, home ownership is more expensive than it has been for most of the last 20 years, but still feasible from a month-to-month affordability standpoint. If borrowers have sensitivity to monthly cost, this suggests that in order for rents to stay competitive relative to home ownership from a pure affordability perspective, rents have to grow slower than home values in a decreasing mortgage rate environment.
Framing Home Ownership as an Investment
In the following section, we'll evaluate the return on investment of homeownership over the years (see Appendix for simplifying assumptions). To do this, first consider the immediate cost impact of transitioning from renting to home ownership (temporarily ignoring financing):
- - Home purchase cost
- - Operating expenses (maintenance, tax, insurance, etc.)
- + Rent no longer paid
Realizing that the avoided rent is the positive component here, it becomes clear that by reframing this saved rent as income, the property investment profile can be viewed with a similar methodology to all other income generating real estate investments. For example, the cap rate would just be:
In order to estimate cap rate with our rent-to-value ratio, a 35% expense ratio assumption (single family rentals typically run between 30-40%) allows for a full definition of the cap rate equation.
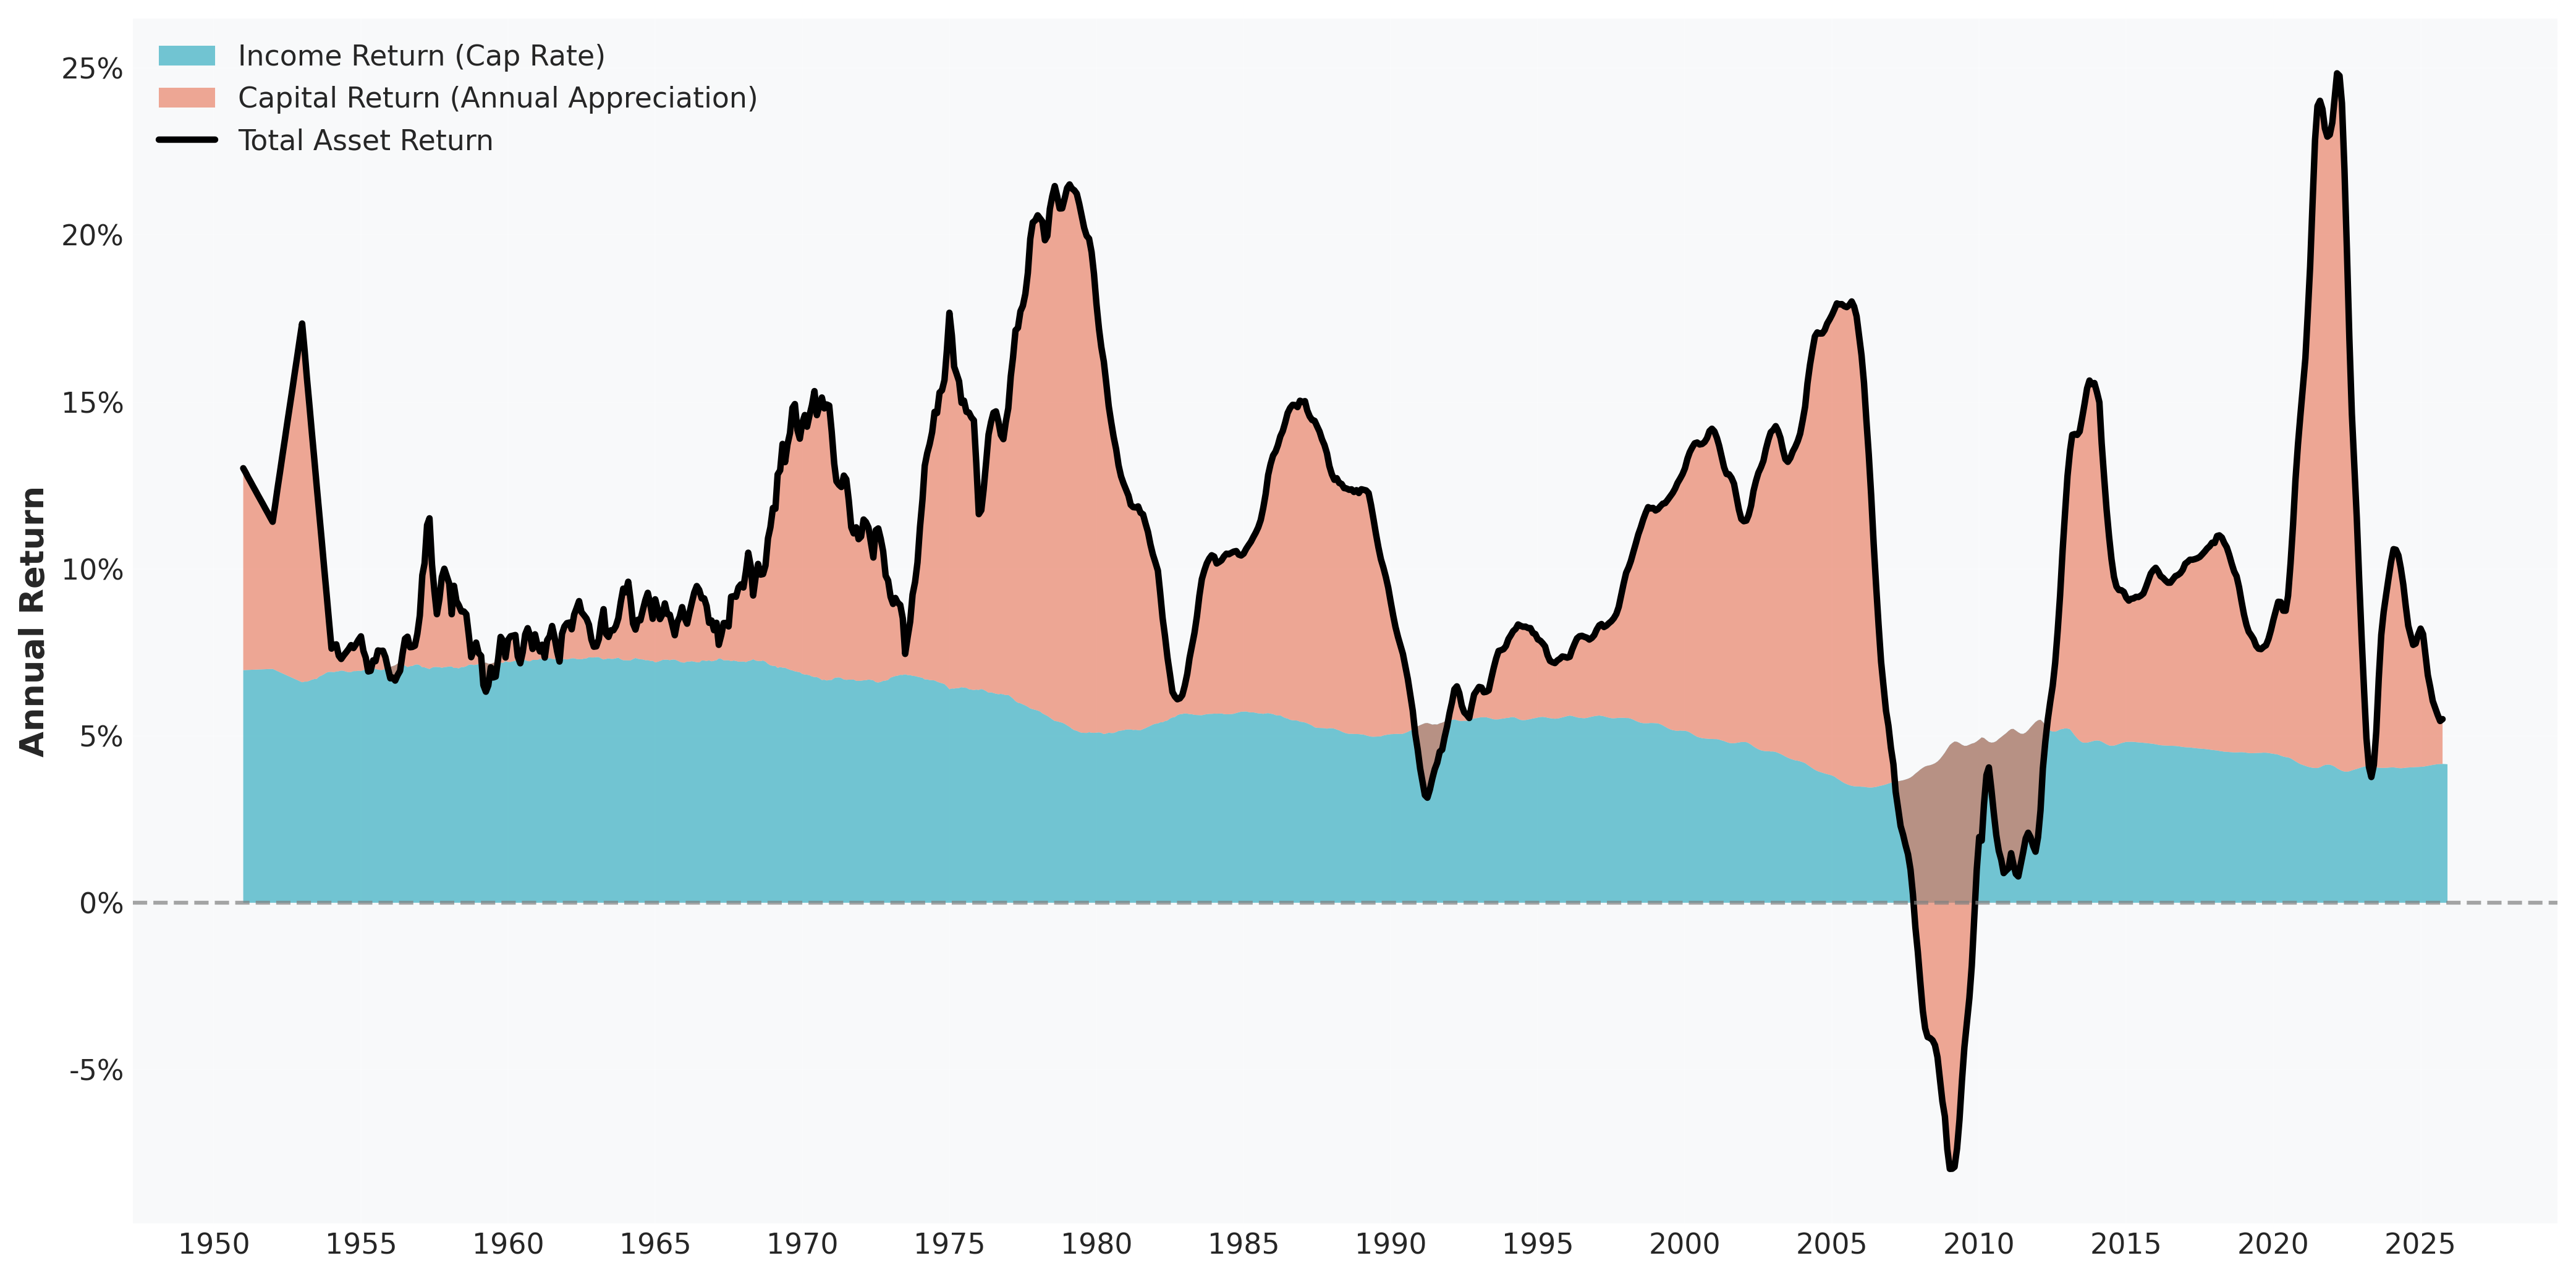
Furthermore, the total asset return can now be calculated by just adding the appreciation from Case-Shiller HPI:
Figure 6 illustrates that while the rent-to-value ratio and thus also cap rate have decreased over the last 75 years, HPA has been the primary driver of variability in total asset return.
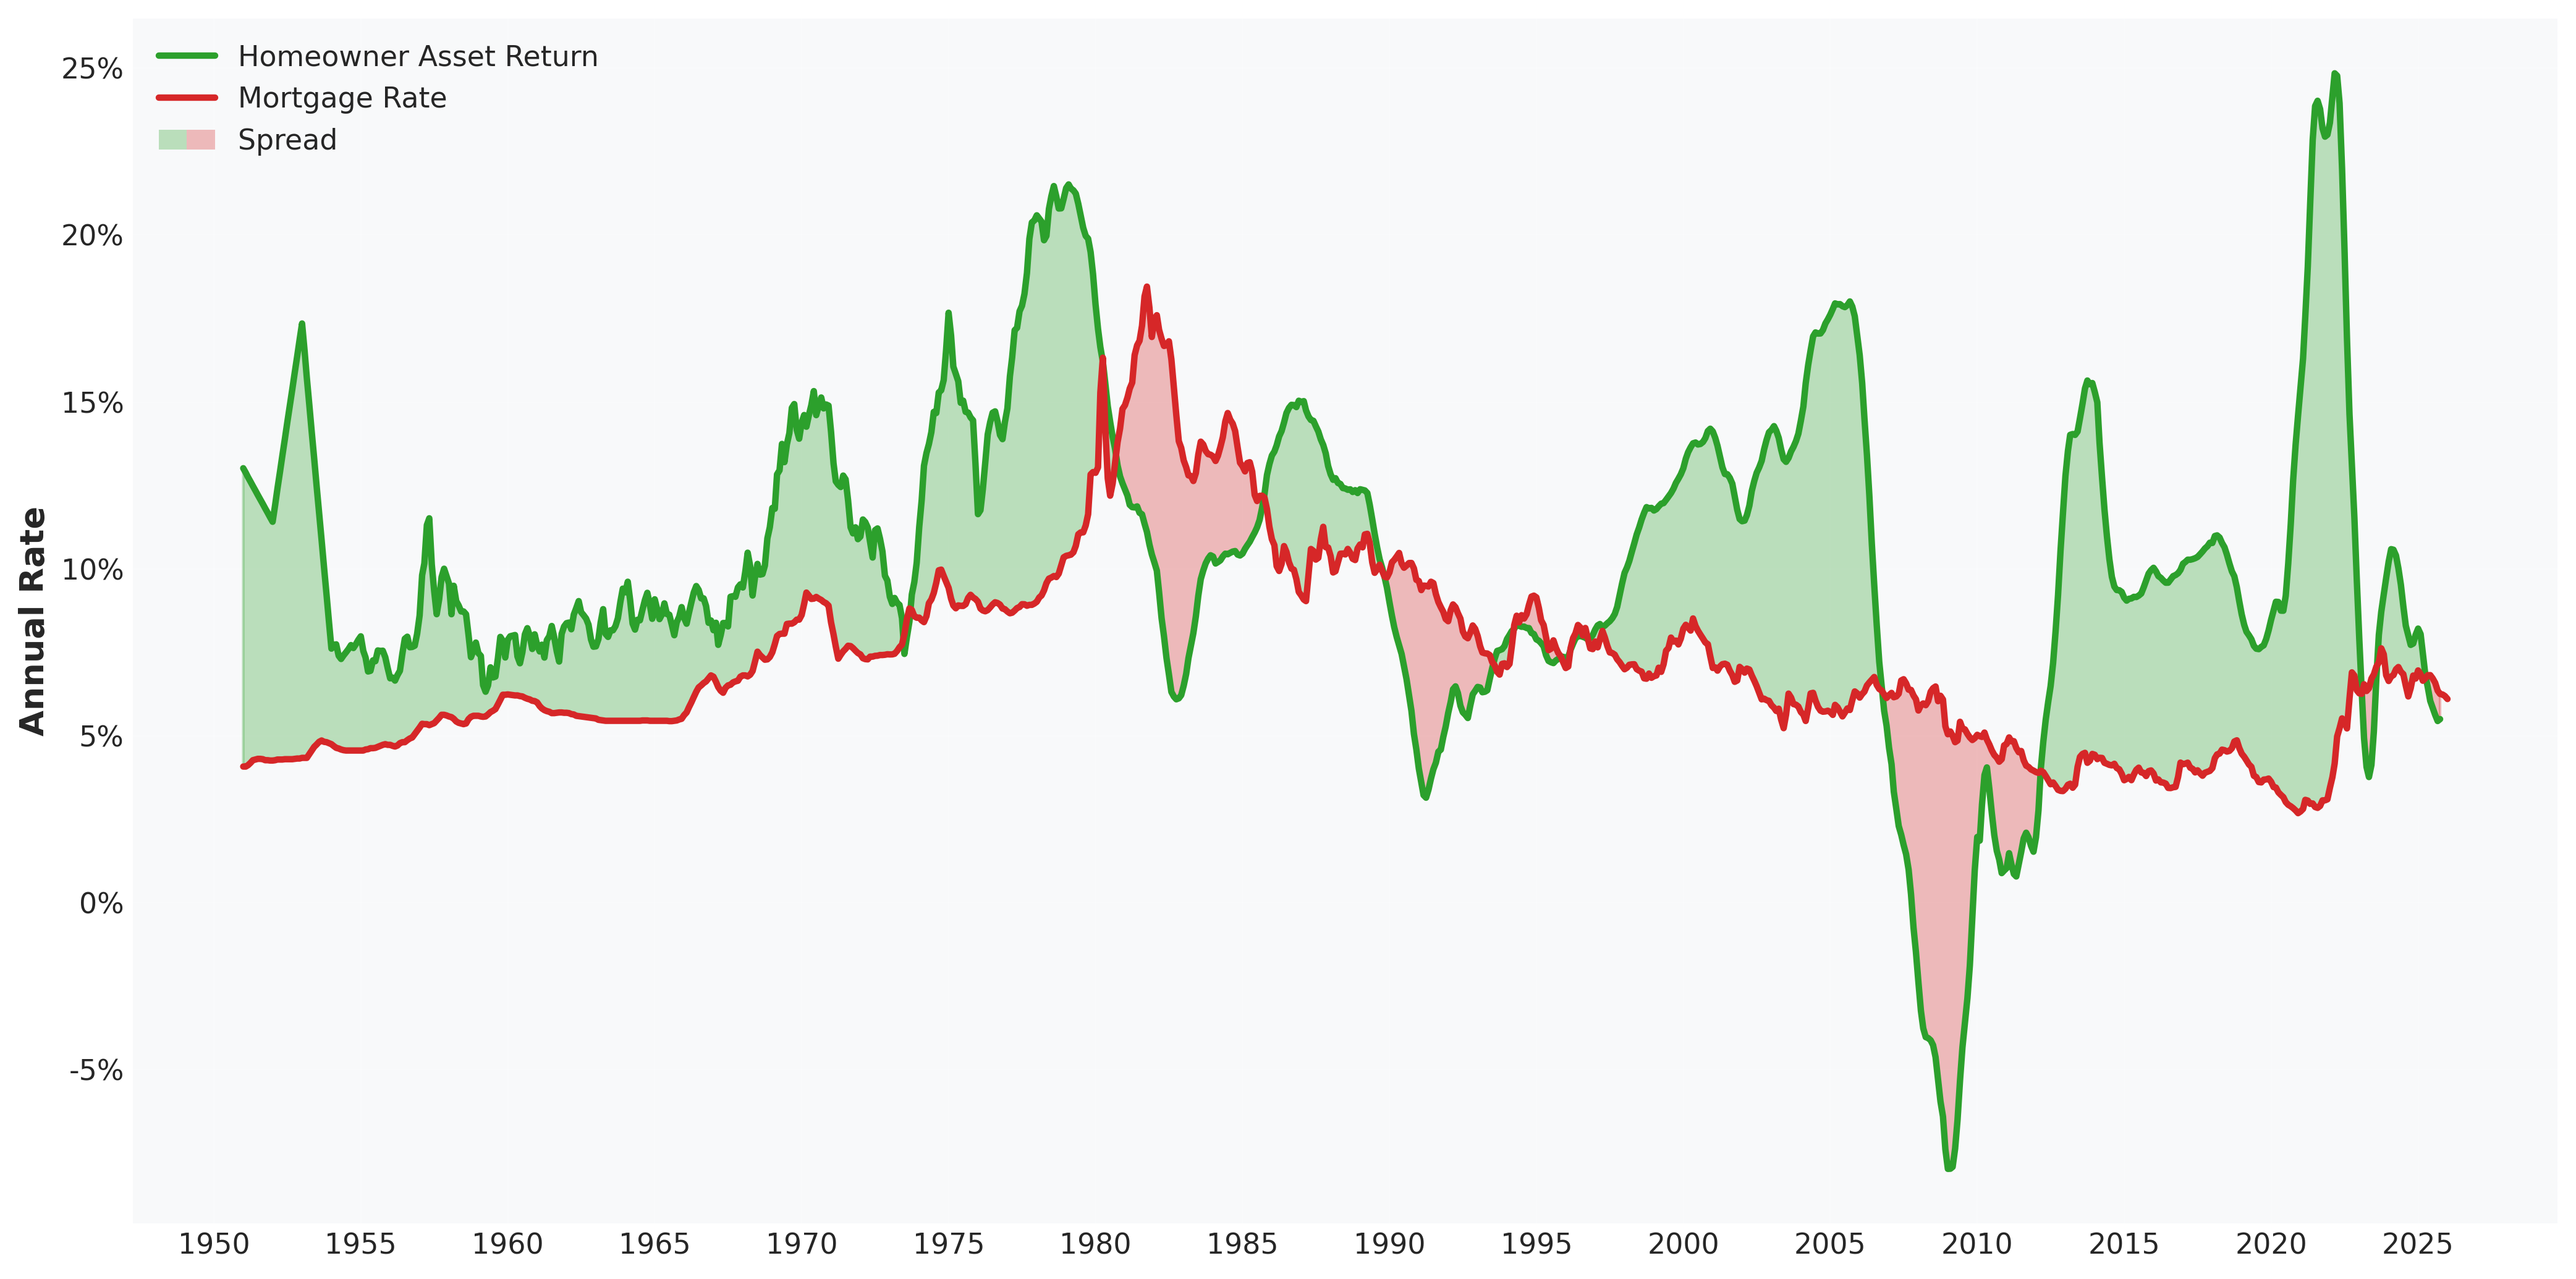
Most homes are bought using mortgage financing, so to estimate the full return, the standard levered return equation can be applied:
Figure 7 illustrates that financing conditions over the last 75 years have generally been economically accretive to homeowners. Exceptions occurred during the recessions of the early 80s, early 90s, and the GFC, as well as under current conditions.
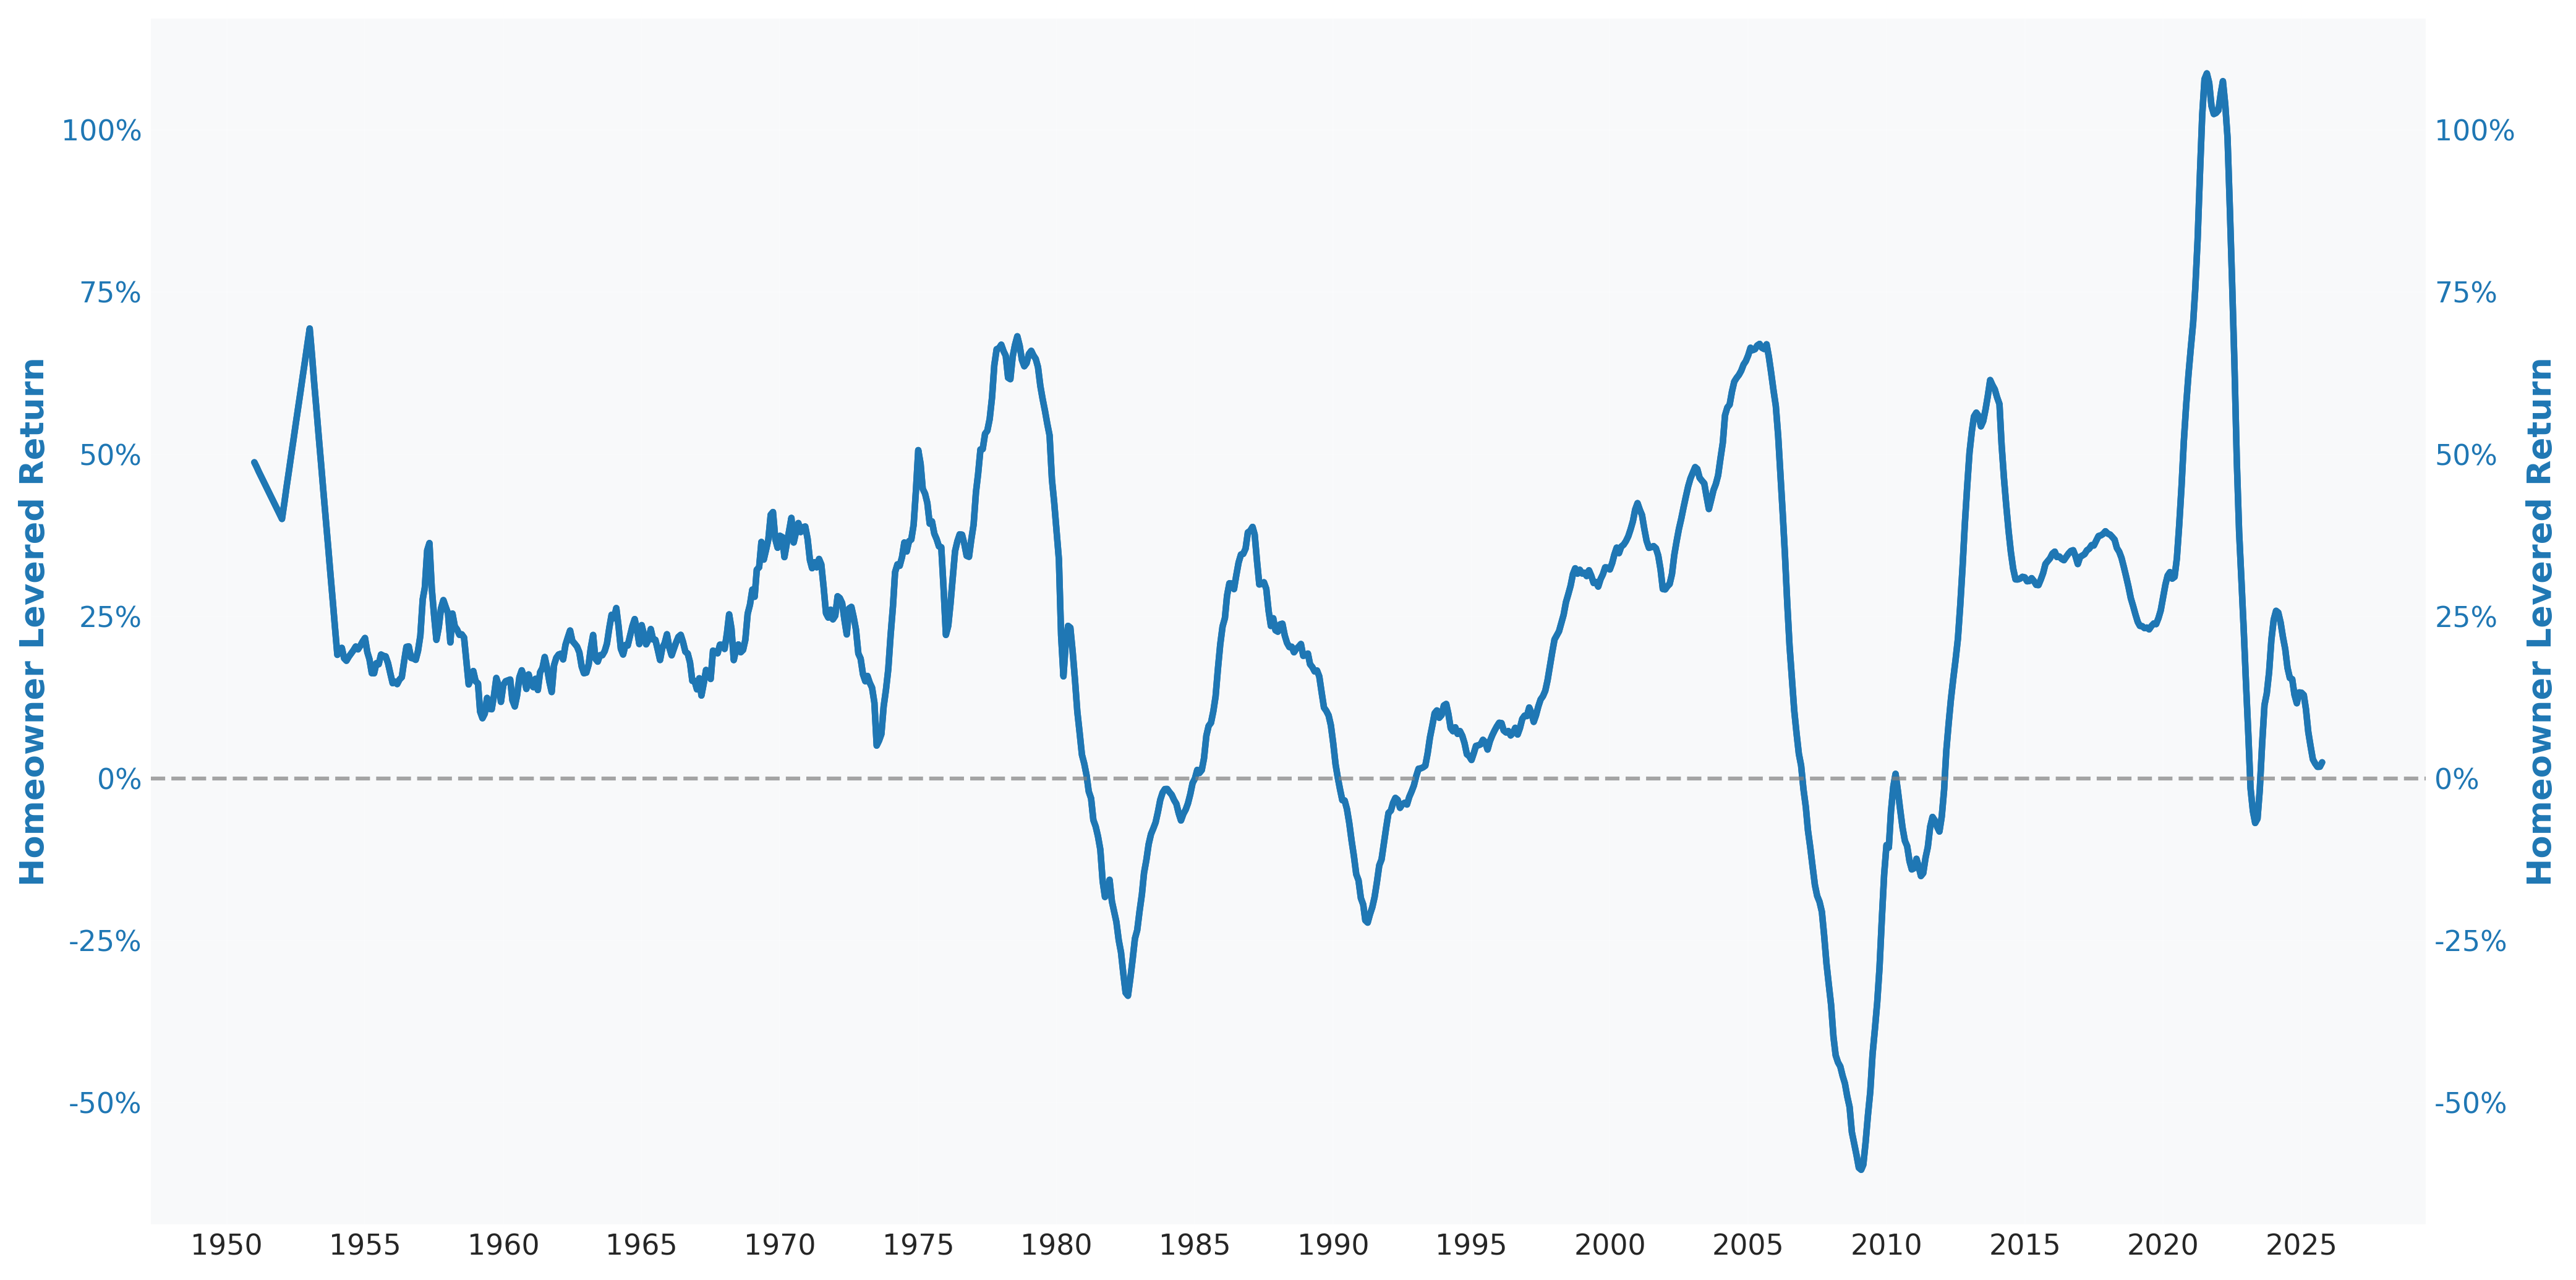
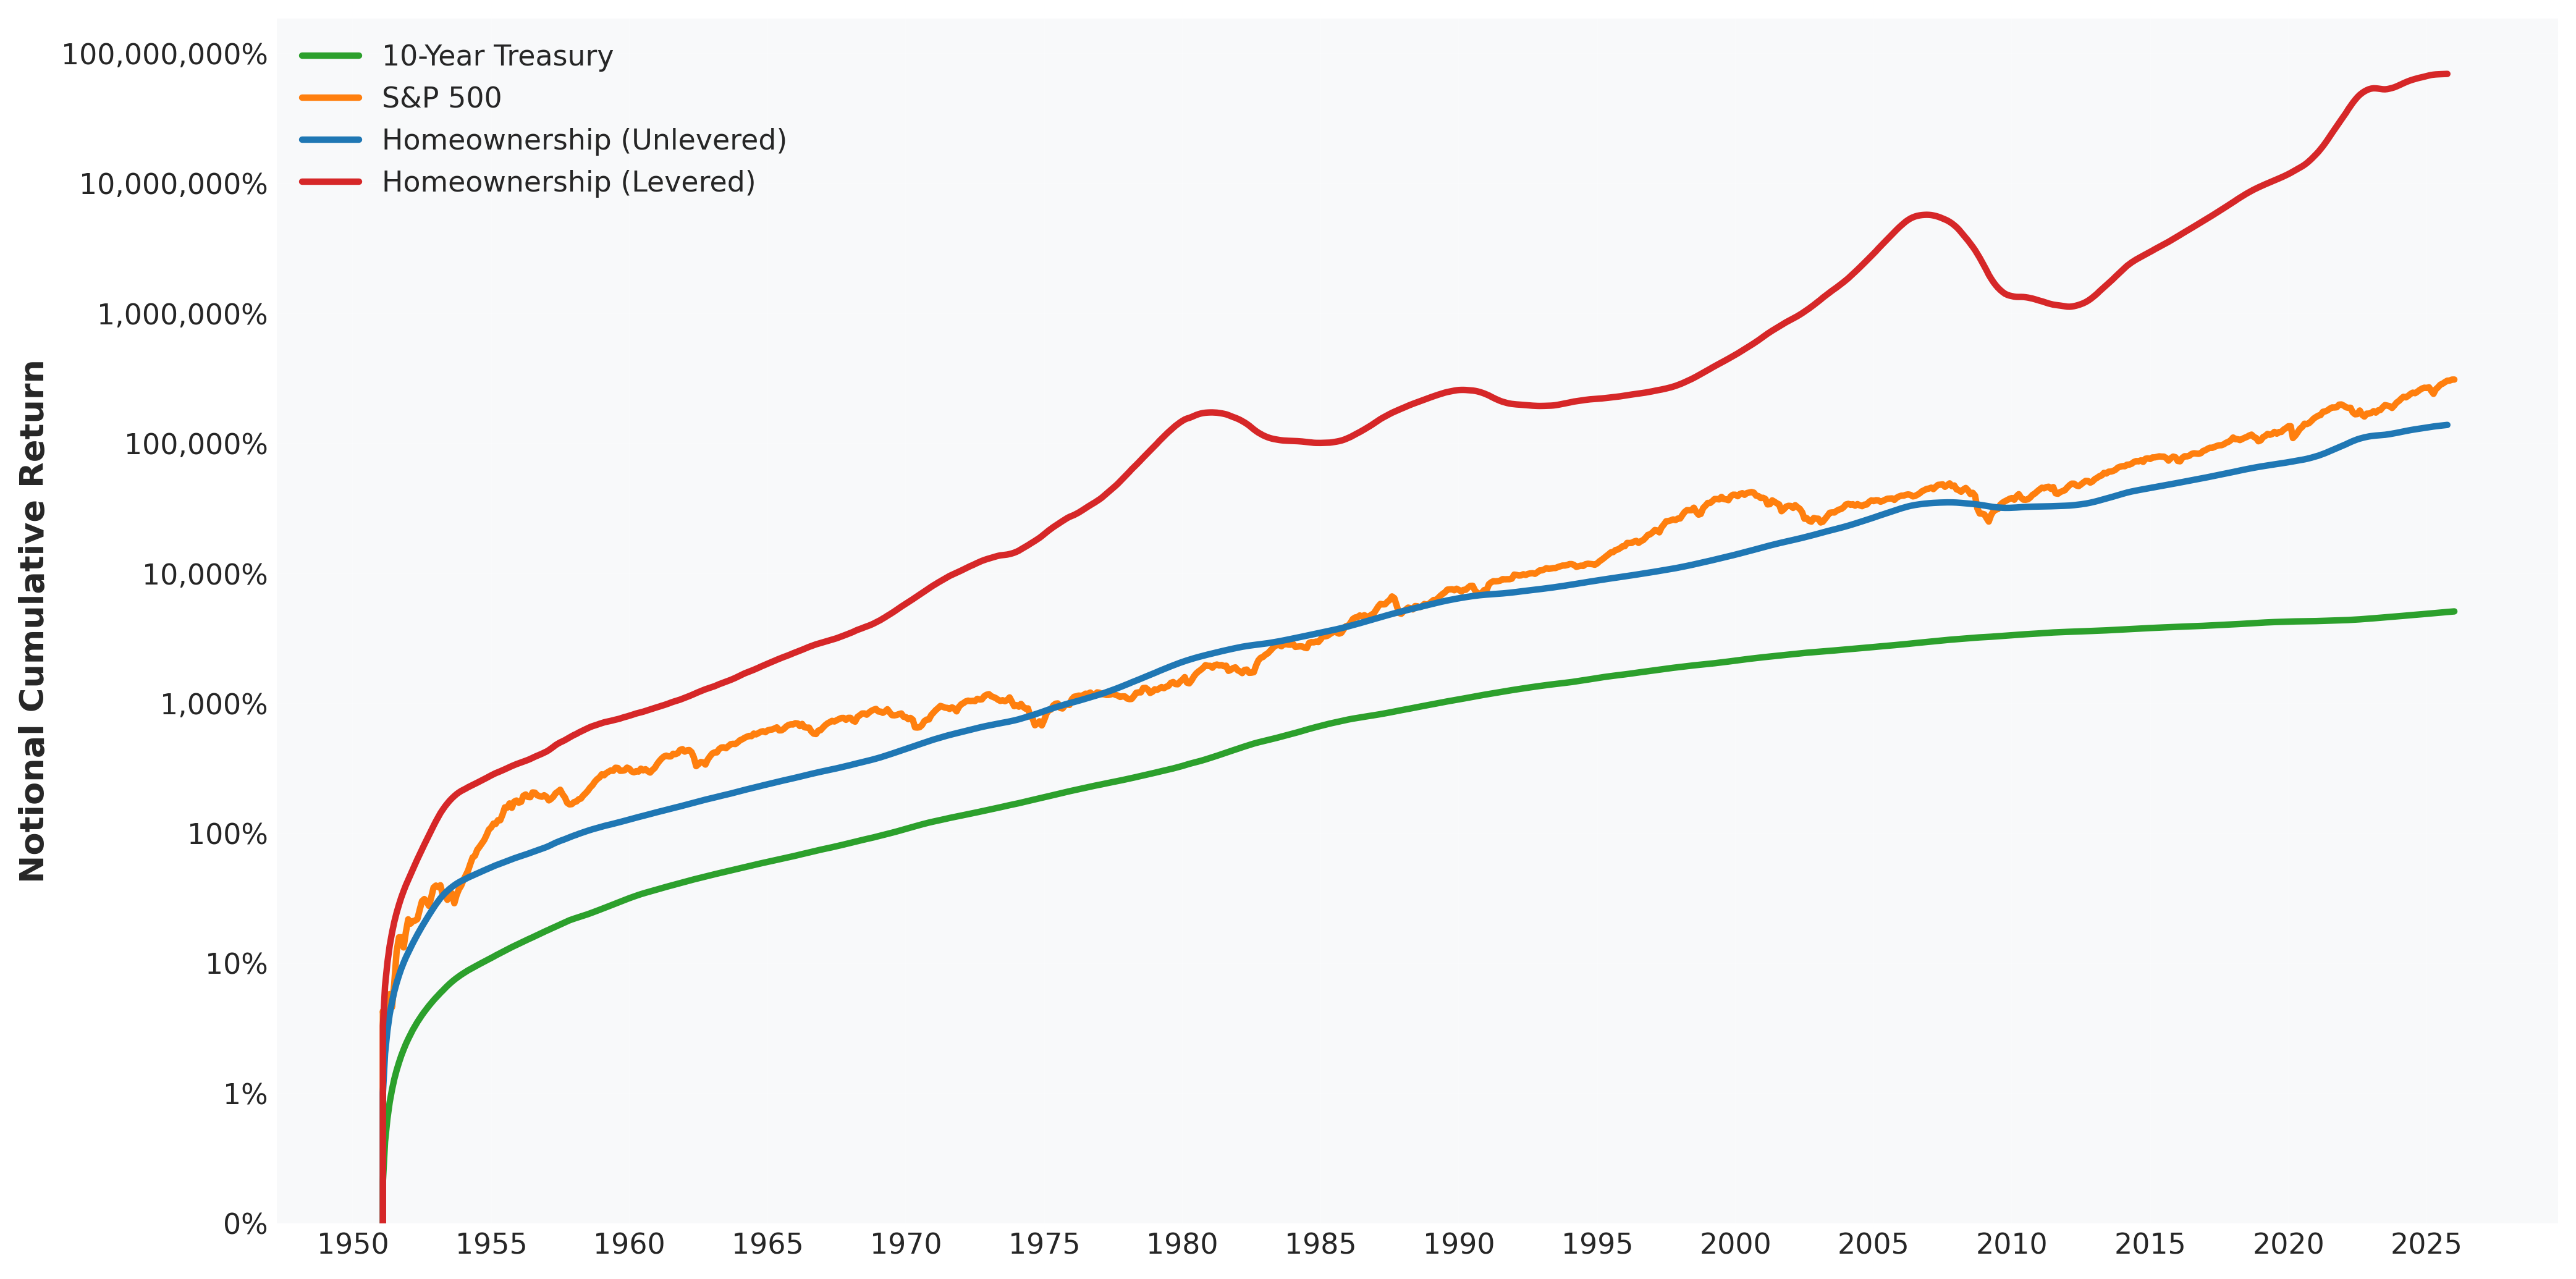
Assuming a standard 80% mortgage LTV, the levered return calculation produces the values in Figure 1. This estimate illustrates the extreme degree to which homeownership has been a driver of wealth accumulation for Americans over the last 75 years.
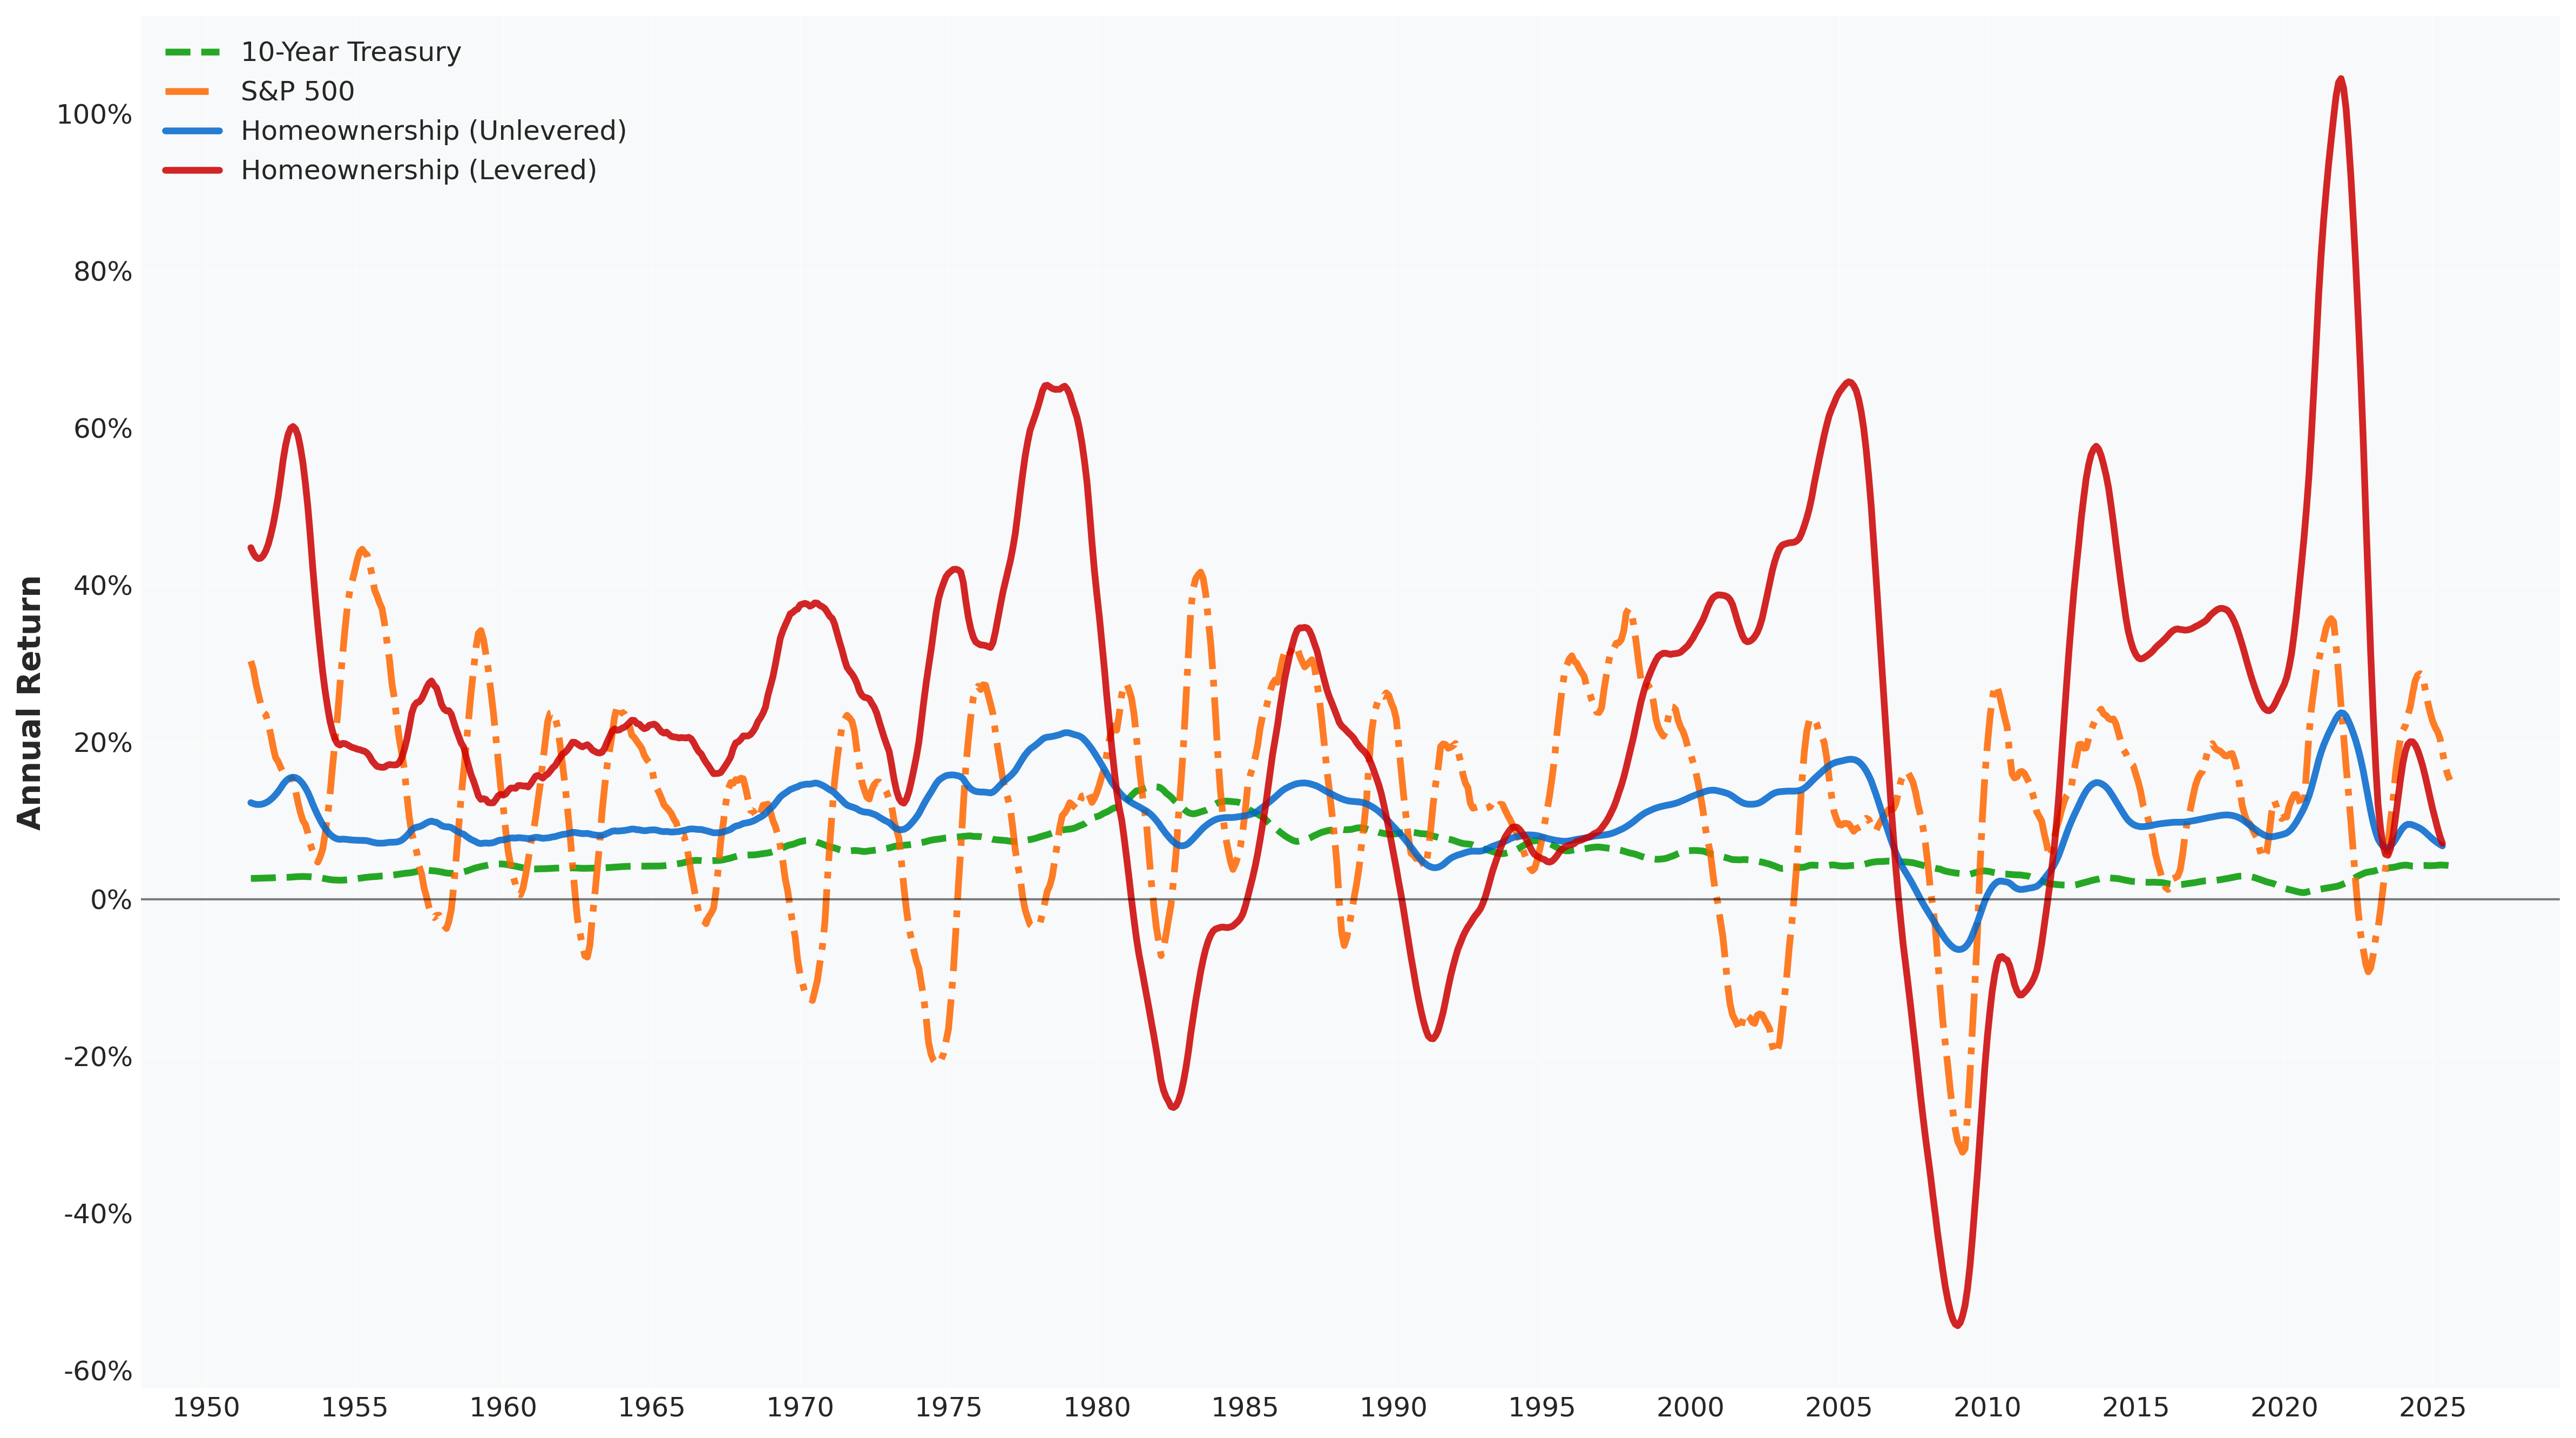
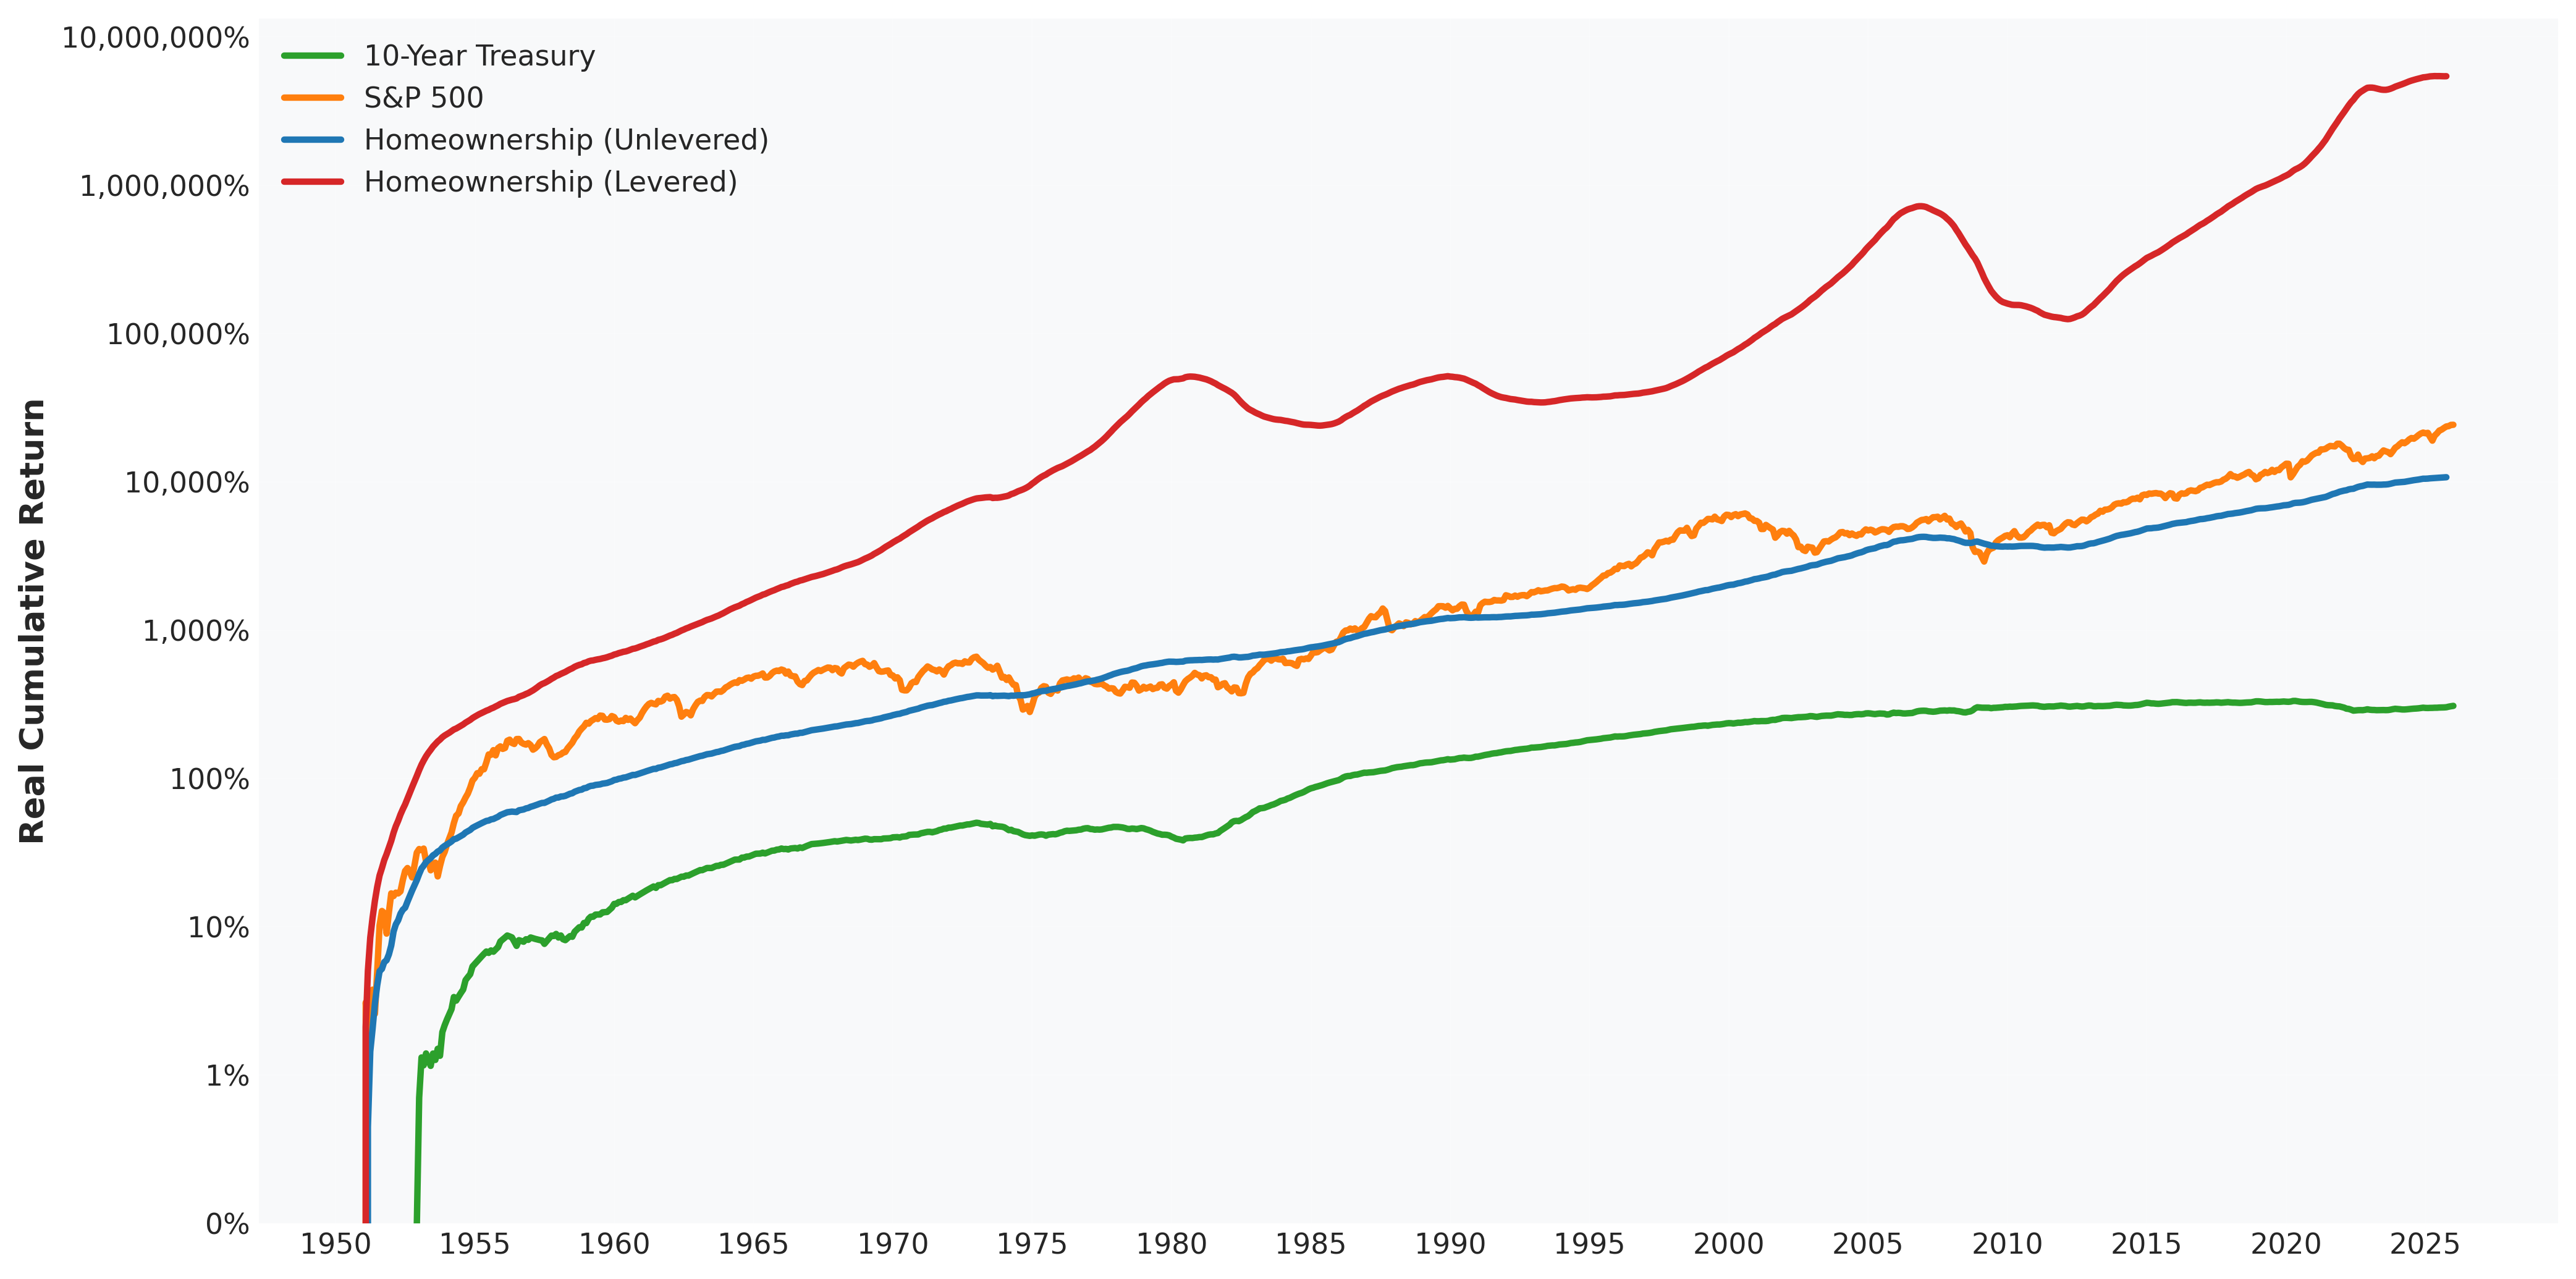
Figures 8, 9, and 10 illustrate the opportunity cost of homeownership by comparing its total returns to a scenario where a renter instead invests the money for down payment and monthly savings into other financial assets. Although stocks have outperformed homes as an unlevered asset, the attractive mortgage leverage infrastructure available to homeowners in the United States has supported ~200x the 75-year cumulative return outcome as stocks.
What Is the Broader Significance of This?
While ROI is likely not explicitly factored into the buy/sell decisions of housing market participants, it certainly has a palpable financial impact on homeowners. If the current negative asset-liability spread in the housing market becomes prolonged, there will likely be negative implications, such as elevated mortgage delinquencies for new borrowers.
Appendix: Methodology Notes
Homeowner Return Assumptions
- Deleveraging from amortization is ignored in the levered return calculation
- Miscellaneous costs not included in operating expenses (closing costs, etc.) are ignored
- Property taxes are factored into operating expenses but other tax impacts of home ownership are ignored
- Cap rate and mortgage rate are plugged into the return equation as nominal annual rates
Data Sources
- Home Prices & Rents: Zillow Home Value Index (ZHVI), Zillow Observed Rent Index (ZORI), Census Median Home Value & Rent, CPI Rent of Primary Residence, and Case-Shiller HPI.
- Macroeconomic & Financial Data: CPI (All Urban Consumers) and 10-Year Treasury Rates from Sidney Homer's A History of Interest Rates and Federal Reserve Economic Data (FRED), and S&P 500 Total Return Index from Robert Shiller’s U.S. Stock Markets 1871-Present data.
- Mortgage Rates: Primary Mortgage Market Survey (PMMS), 30-Year FHA Mortgage Rate (Secondary Market), and Secondary Market Yields on FHA Mortgages (NBER Macrohistory Database).